51 / 481 个模板 · 第 2/3 页
暂无图片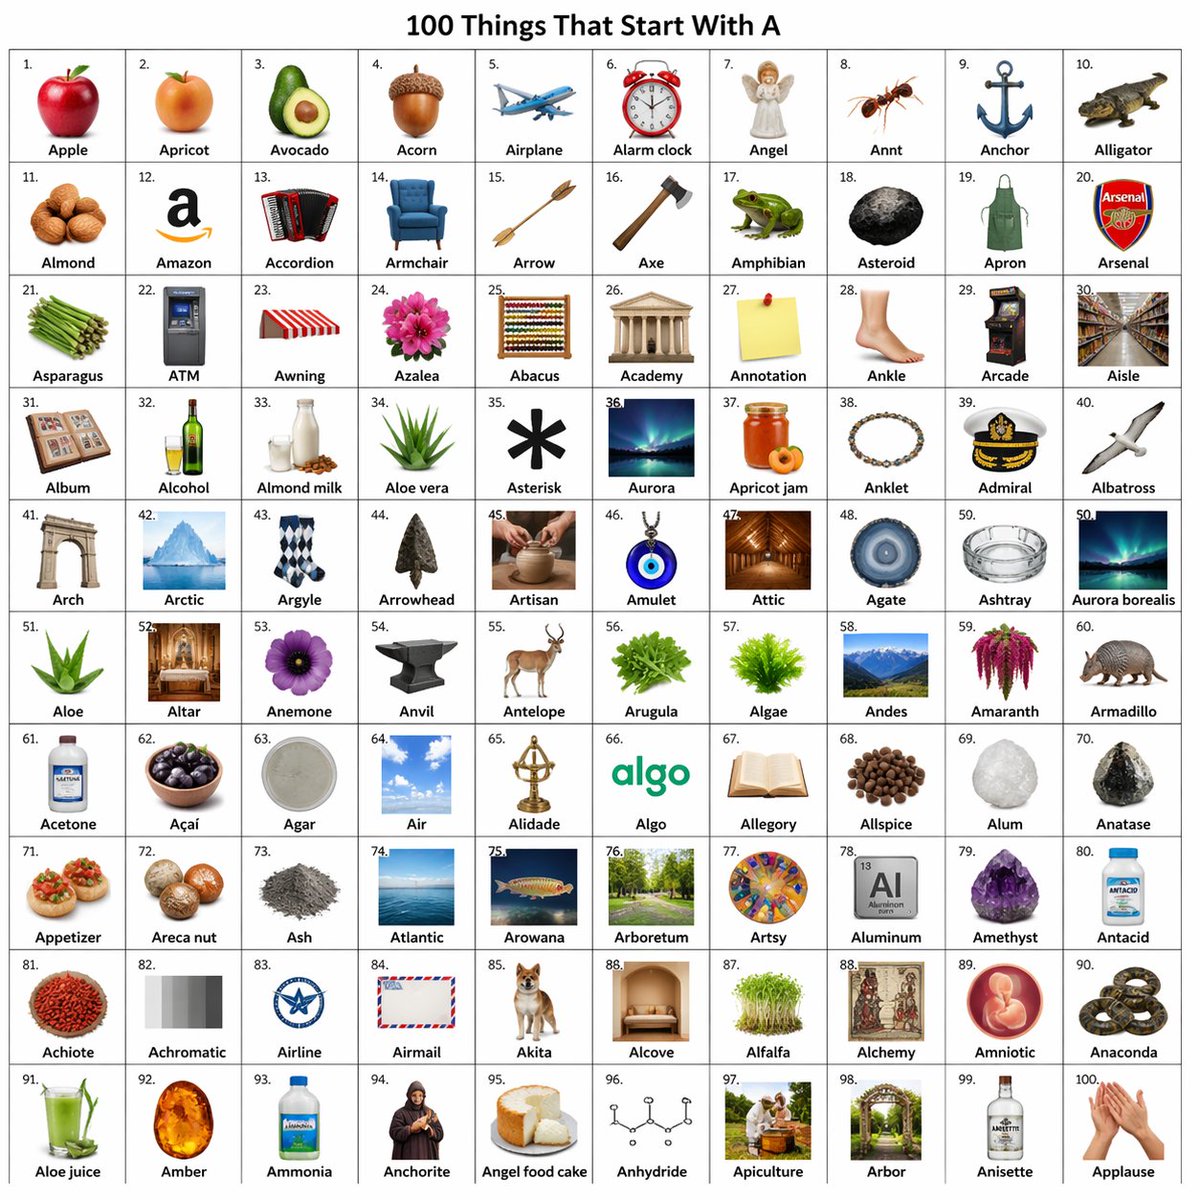
信息图可视化设计
Charts & Infographics
信息图可视化设计
Charts & Infographics
[中文] 创建一个包含 10x10 网格的图像,每个对象名称都以字母 a 开头。 [English] create an image with 10x10 grid of objects that have the names starting with letter a.
@umesh_ai
暂无图片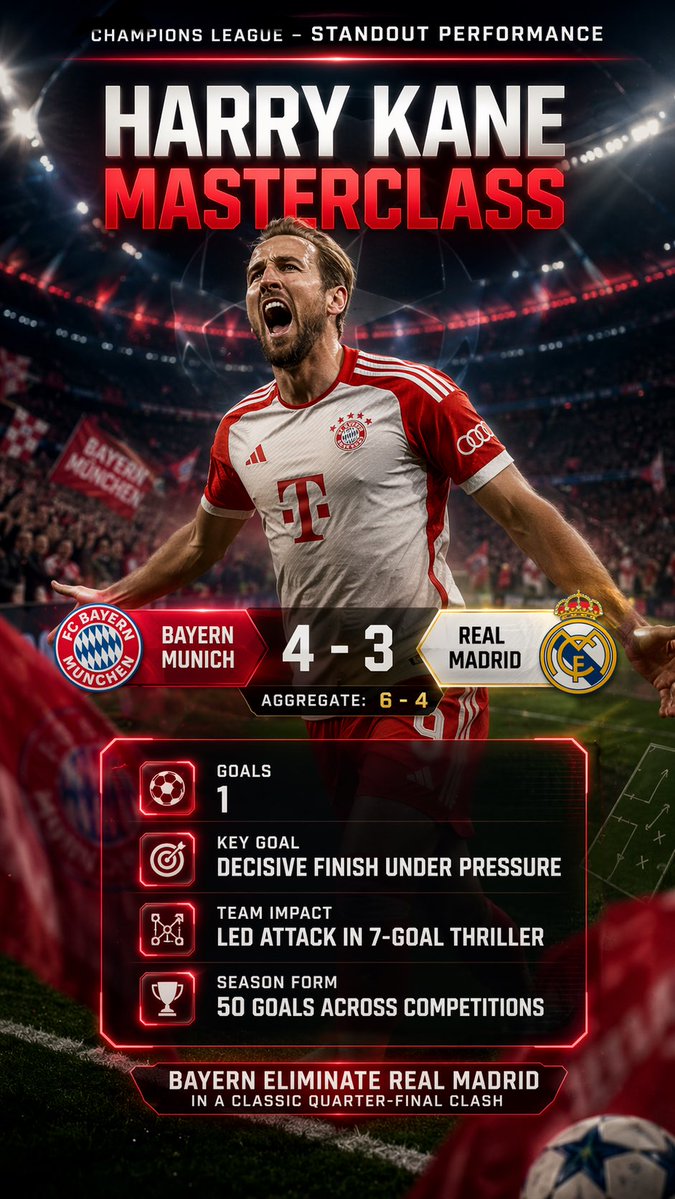
信息图可视化设计
Charts & Infographics
信息图可视化设计
Charts & Infographics
Search the web for {argument name="performance description" default="this week’s standout individual performance in Champion’s League"}, using exact stats and game summary, {argument name="colors" default="bold team colors"}, legible score breakdown, and generate a {argument name="card type" default="Highlight card"}.
@maxescu
暂无图片
信息图可视化设计
Charts & Infographics
信息图可视化设计
Charts & Infographics
GPT-Image-2 prompt: please automatically generate a top-tier concept poster / infographic-style movie poster centered around {argument name="theme" default="ranking of emperors in Chinese history"}. Require the AI to automatically derive and uniformly design the entire following visual system based on this theme, without my extra specification: - Core subject (automatically judge suitability for people, products, architecture, artifacts, symbols, scenes, or abstract imagery) - Bottom supporting structure - Hovering symbols or spiritual symbols above - Scene wrapping elements - Metaphor system - Color hierarchy - Material contrast - Lighting logic - Title, subtitle, and auxiliary copy - Brand sense and high-end expression The final frame must be: a shocking, precise, unified, cinematic, ultra-high detail conceptual key visual poster suitable for high-end printing. [Overall Style] Ultra-realistic 3D commercial CGI rendering, merging cinematic lighting, luxury visual language, futuristic concept design, and epic composition. The image must have a "single main visual core," not messy, not like a collage, and not like a regular e-commerce poster. [Automatic Derivation Rules] AI must automatically decide based on the [theme]: 1. Core visual metaphor 2. Subject type and posture 3. Form of supporting structure 4. Form of suspended elements 5. Scene shell and spatial atmosphere 6. Main, auxiliary, and emphasis colors 7. Material combinations 8. Text temperament and layout style [Composition Rules] - Absolute sense of premium quality - Strong central order, overall unity - Allows for axial symmetry or epic composition near the central axis - Clear visual gravity, forming clear levels from top to bottom - Edge negative space is clean, restrained, and has room to breathe [Visual Quality] - Ultra-high detail - Clear volumetric light - Authentic materials - Natural reflection, refraction, shadows, fog, and depth of field - Overall standard of high-end brand campaign key visual / luxury invitation poster / conceptual editorial poster [Typography System] - Overall 90% visual, 10% text - AI automatically generates the most matching main title and subtitle based on the [theme] - Title must be concise, sharp, and powerful - Text should be as minimal and accurate as possible; do not stack words [Signature Requirement] Naturally add the author signature in the bottom corner: @a9quant
@A9Quant
暂无图片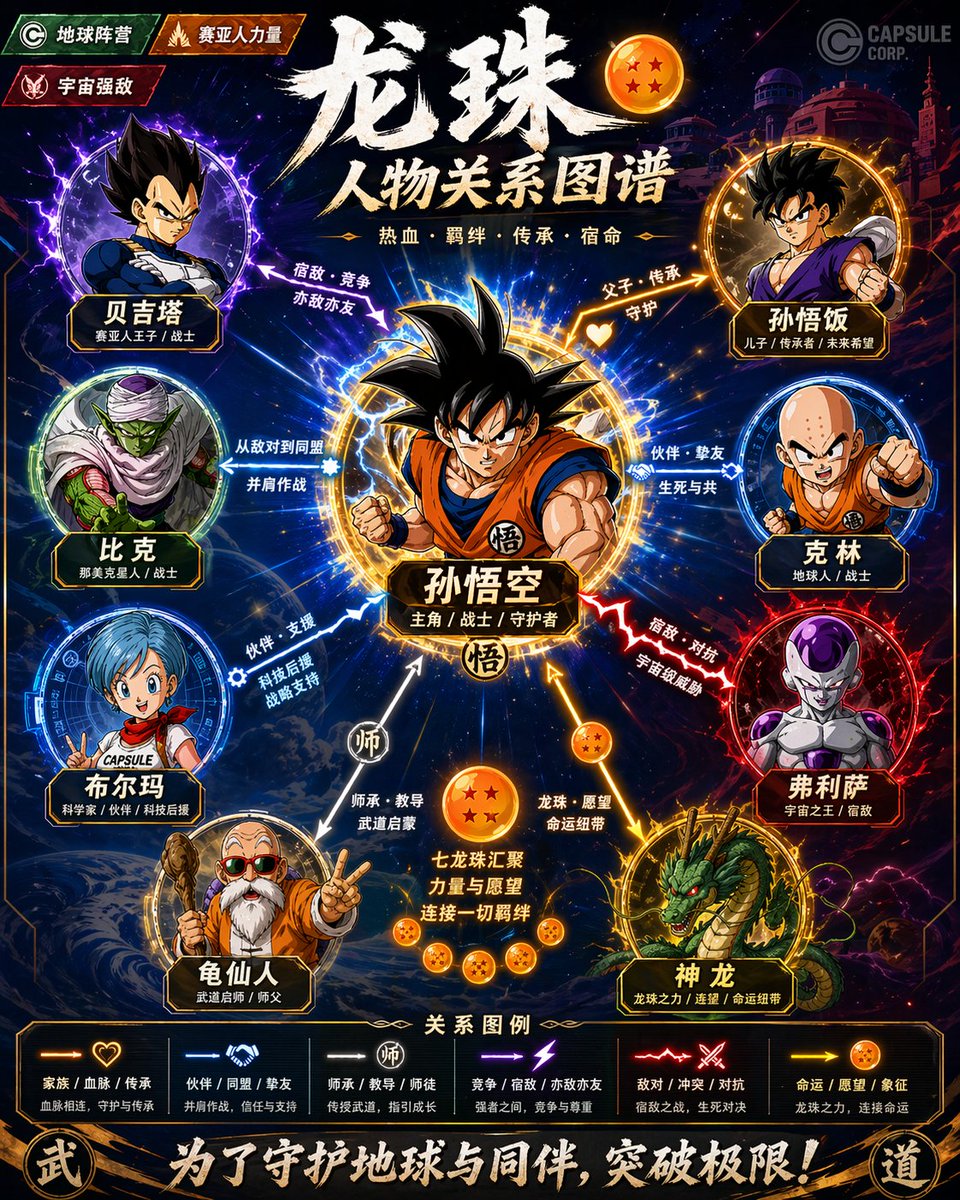
关系图谱信息图
Charts & Infographics
关系图谱信息图
Charts & Infographics
Please generate a high-design character relationship map poster based on {argument name="theme" default="Demon Slayer"}. This image should not be a simple illustration, but a character relationship map that combines information visualization, narrative structure, poster design sense, and stylistic fidelity. Please automatically complete the following: - Identify the work and core settings corresponding to the theme - Extract the most representative 6–12 key characters, not exceeding 15 if necessary - Identify and display key character relationships, including blood ties, romance, friendship, alliances, hostility, master-disciple, etc. - Automatically choose a composition method based on the work's characteristics, such as protagonist-centered, dual-core confrontation, faction-based, family tree, or chronological evolution - Automatically refine the work's style DNA, including color, worldview symbols, textures, mood, typography, and representative elements - Transform these stylistic elements into an overall visual design for the relationship map, rather than simply copying an official poster - Use different colors, line types, and arrows to distinguish different relationships, ensuring clear lines and layers without clutter - Make core characters most prominent, followed by important characters, and subordinate characters weakened to form a clear visual hierarchy - Ensure every character name is legible, with identity or faction labels if necessary The final product should satisfy: - Immediate understanding of character hierarchy and key relationships - Obvious alignment with the original work's temperament and setting - Combines the clarity of an infographic with the premium design of a poster - Unified, exquisite, complete, and suitable for social media sharing or poster display - Avoids a cheap flowchart feel, messy piling, and information overload.
@MrLarus
暂无图片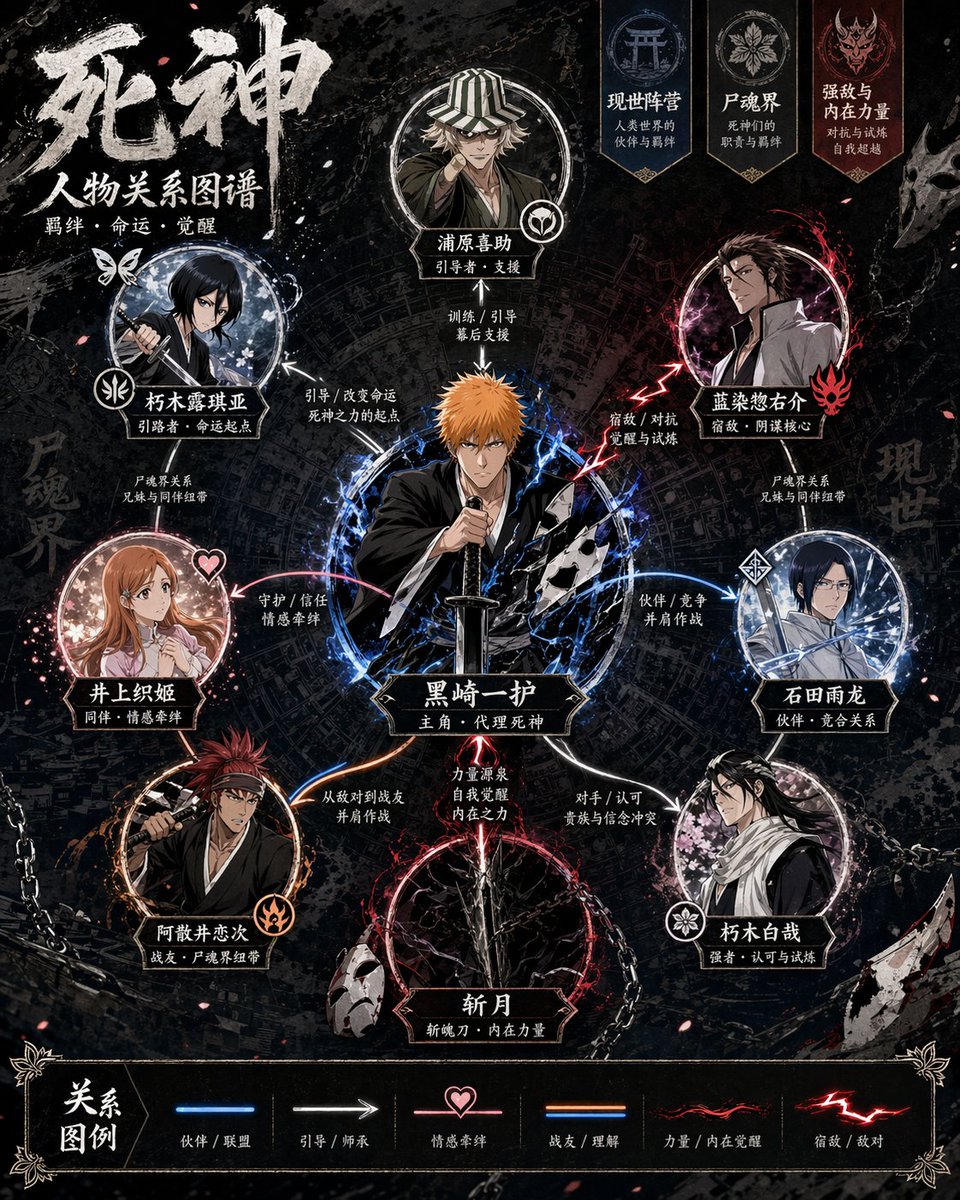
关系图谱信息图
Charts & Infographics
关系图谱信息图
Charts & Infographics
Please generate a high-design character relationship map poster based on {argument name="theme" default="Demon Slayer"}. This image should not be a simple illustration, but a character relationship map that combines information visualization, narrative structure, poster design sense, and stylistic fidelity. Please automatically complete the following: - Identify the work and core settings corresponding to the theme - Extract the most representative 6–12 key characters, not exceeding 15 if necessary - Identify and display key character relationships, including blood ties, romance, friendship, alliances, hostility, master-disciple, etc. - Automatically choose a composition method based on the work's characteristics, such as protagonist-centered, dual-core confrontation, faction-based, family tree, or chronological evolution - Automatically refine the work's style DNA, including color, worldview symbols, textures, mood, typography, and representative elements - Transform these stylistic elements into an overall visual design for the relationship map, rather than simply copying an official poster - Use different colors, line types, and arrows to distinguish different relationships, ensuring clear lines and layers without clutter - Make core characters most prominent, followed by important characters, and subordinate characters weakened to form a clear visual hierarchy - Ensure every character name is legible, with identity or faction labels if necessary The final product should satisfy: - Immediate understanding of character hierarchy and key relationships - Obvious alignment with the original work's temperament and setting - Combines the clarity of an infographic with the premium design of a poster - Unified, exquisite, complete, and suitable for social media sharing or poster display - Avoids a cheap flowchart feel, messy piling, and information overload.
@MrLarus
暂无图片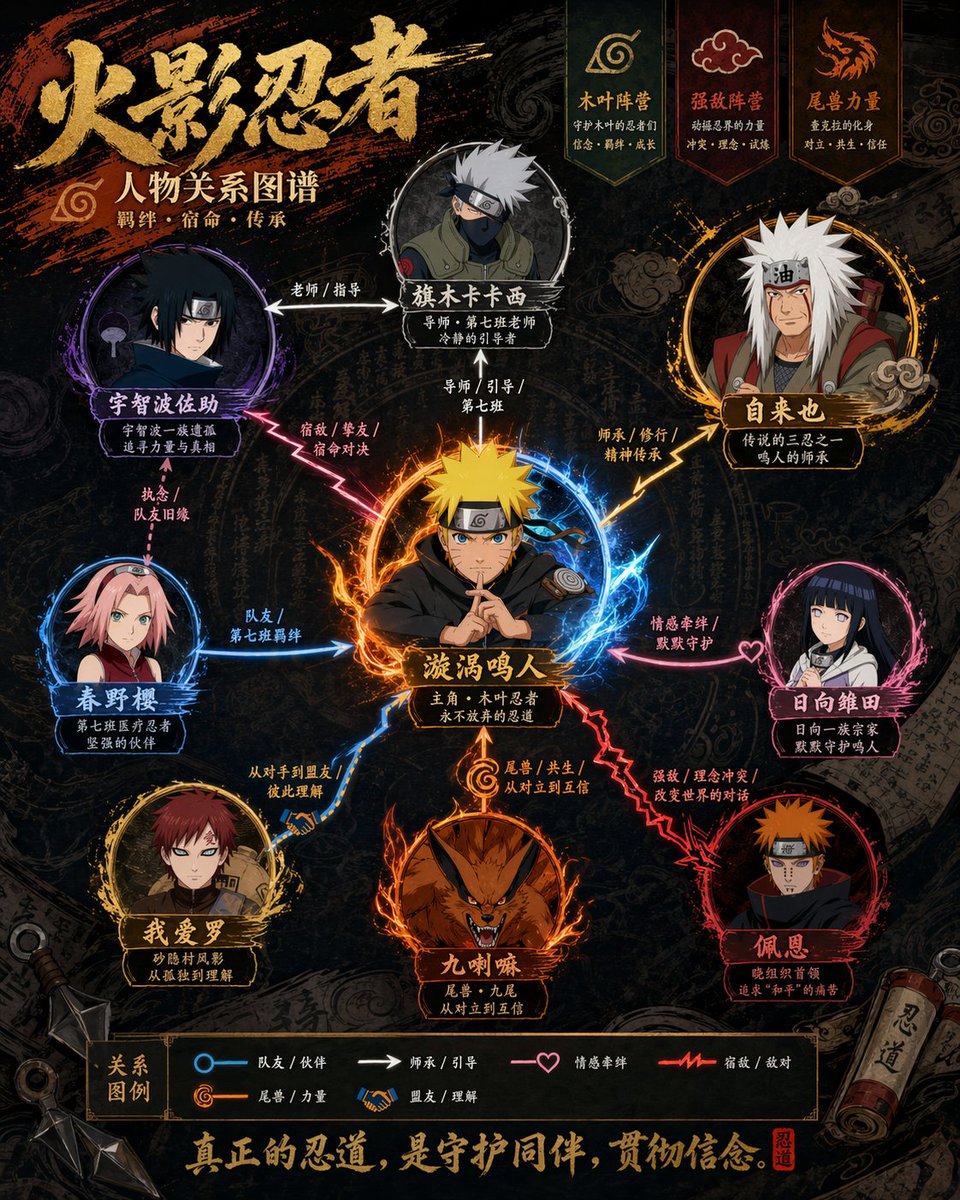
关系图谱信息图
Charts & Infographics
关系图谱信息图
Charts & Infographics
Please generate a high-design character relationship map poster based on {argument name="theme" default="Demon Slayer"}. This image should not be a simple illustration, but a character relationship map that combines information visualization, narrative structure, poster design sense, and stylistic fidelity. Please automatically complete the following: - Identify the work and core settings corresponding to the theme - Extract the most representative 6–12 key characters, not exceeding 15 if necessary - Identify and display key character relationships, including blood ties, romance, friendship, alliances, hostility, master-disciple, etc. - Automatically choose a composition method based on the work's characteristics, such as protagonist-centered, dual-core confrontation, faction-based, family tree, or chronological evolution - Automatically refine the work's style DNA, including color, worldview symbols, textures, mood, typography, and representative elements - Transform these stylistic elements into an overall visual design for the relationship map, rather than simply copying an official poster - Use different colors, line types, and arrows to distinguish different relationships, ensuring clear lines and layers without clutter - Make core characters most prominent, followed by important characters, and subordinate characters weakened to form a clear visual hierarchy - Ensure every character name is legible, with identity or faction labels if necessary The final product should satisfy: - Immediate understanding of character hierarchy and key relationships - Obvious alignment with the original work's temperament and setting - Combines the clarity of an infographic with the premium design of a poster - Unified, exquisite, complete, and suitable for social media sharing or poster display - Avoids a cheap flowchart feel, messy piling, and information overload.
@MrLarus
暂无图片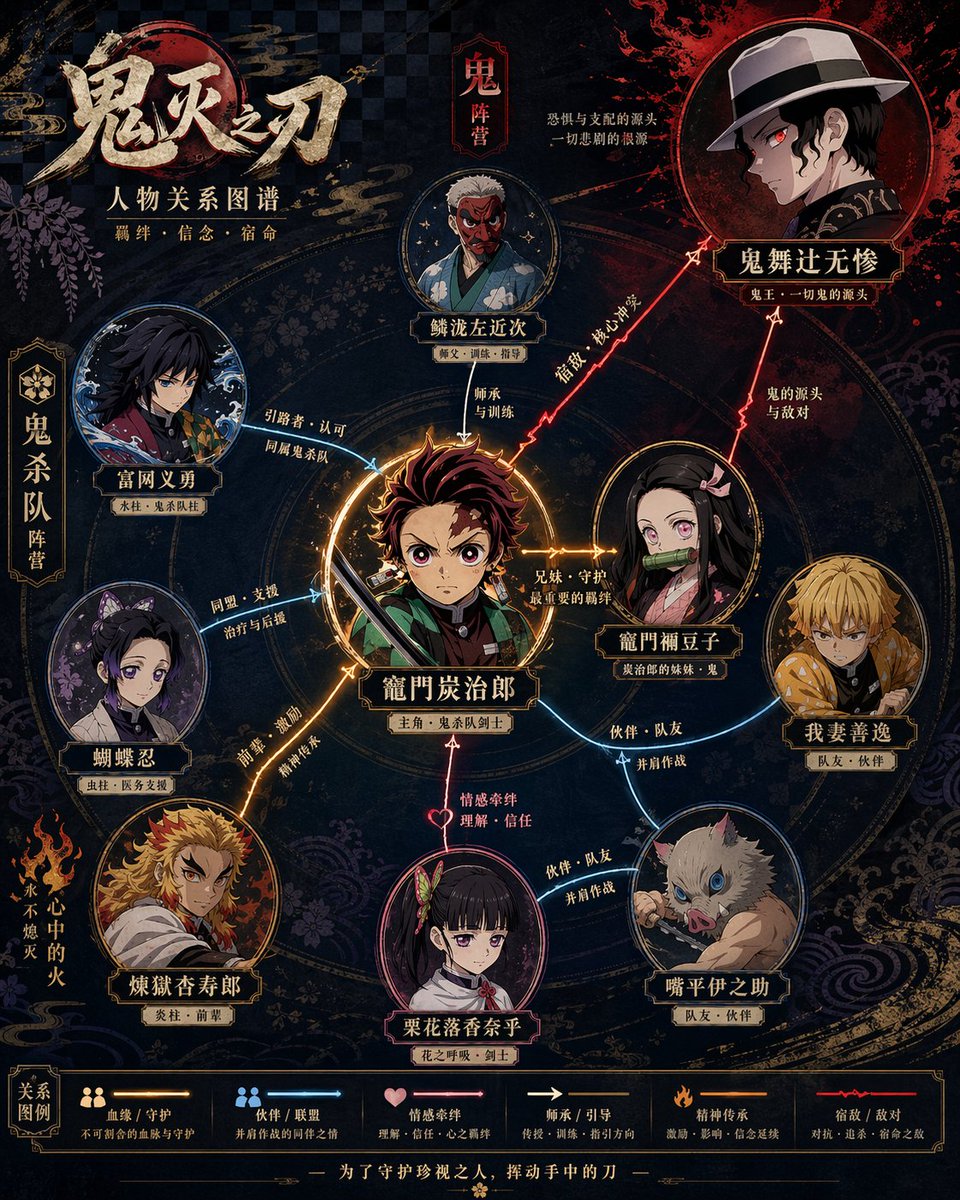
关系图谱信息图
Charts & Infographics
关系图谱信息图
Charts & Infographics
Please generate a high-design character relationship map poster based on {argument name="theme" default="Demon Slayer"}. This image should not be a simple illustration, but a character relationship map that combines information visualization, narrative structure, poster design sense, and stylistic fidelity. Please automatically complete the following: - Identify the work and core settings corresponding to the theme - Extract the most representative 6–12 key characters, not exceeding 15 if necessary - Identify and display key character relationships, including blood ties, romance, friendship, alliances, hostility, master-disciple, etc. - Automatically choose a composition method based on the work's characteristics, such as protagonist-centered, dual-core confrontation, faction-based, family tree, or chronological evolution - Automatically refine the work's style DNA, including color, worldview symbols, textures, mood, typography, and representative elements - Transform these stylistic elements into an overall visual design for the relationship map, rather than simply copying an official poster - Use different colors, line types, and arrows to distinguish different relationships, ensuring clear lines and layers without clutter - Make core characters most prominent, followed by important characters, and subordinate characters weakened to form a clear visual hierarchy - Ensure every character name is legible, with identity or faction labels if necessary The final product should satisfy: - Immediate understanding of character hierarchy and key relationships - Obvious alignment with the original work's temperament and setting - Combines the clarity of an infographic with the premium design of a poster - Unified, exquisite, complete, and suitable for social media sharing or poster display - Avoids a cheap flowchart feel, messy piling, and information overload.
@MrLarus
暂无图片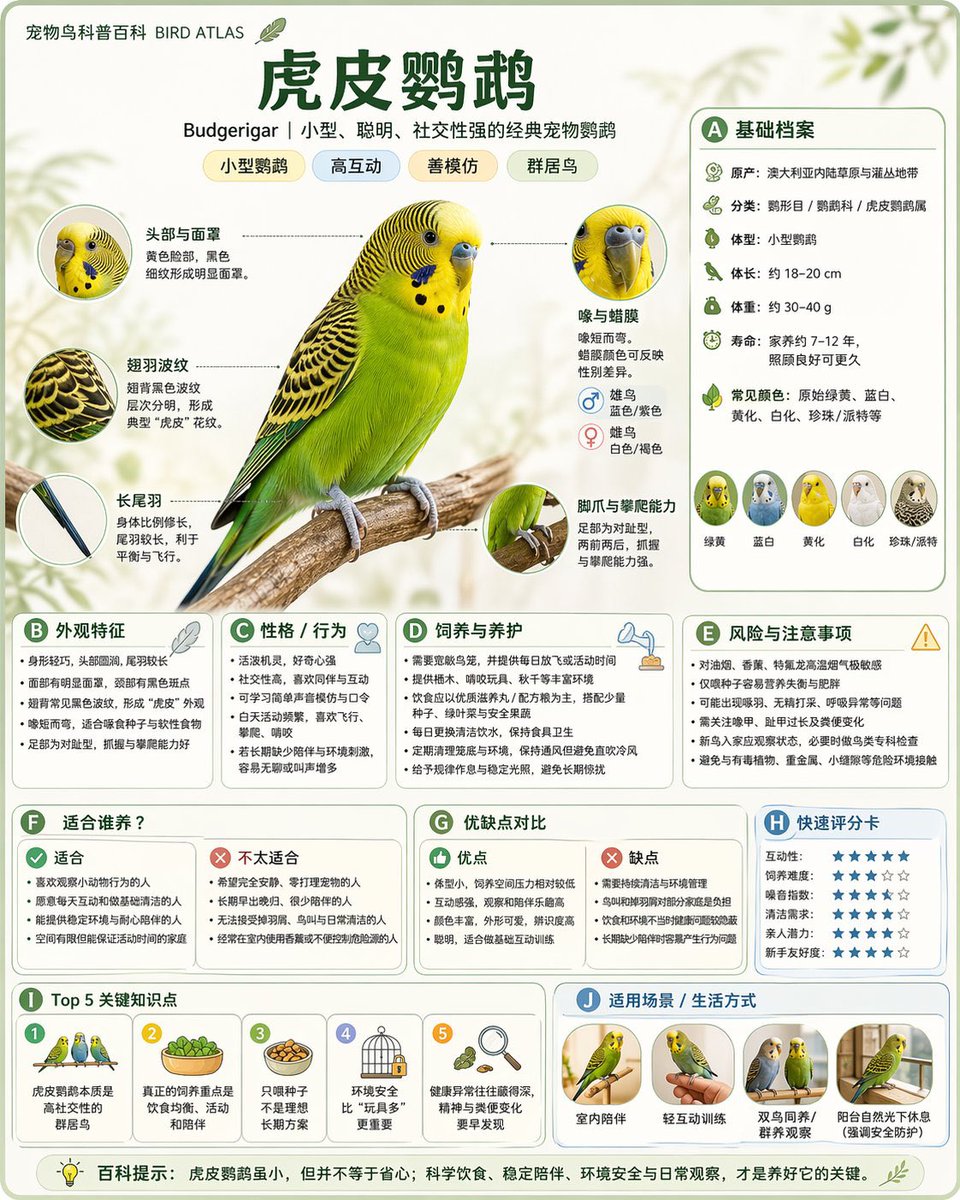
关系图谱信息图
Charts & Infographics
关系图谱信息图
Charts & Infographics
Please generate a high-quality vertical "Popular Science Encyclopedia Image" based on {argument name="theme" default="animals"}. This image is not a regular poster or a simple illustration, but a modular popular science infographic that possesses a sense of "illustration book, encyclopedia, information structure, and collectability." The overall style should reference a combination of high-end natural history illustrations, modern encyclopedia pages, lifestyle knowledge cards, and highly shareable social media infographics. Please include in the frame: - A clear and beautiful main visual of the subject - Several magnified details of local characteristics - Multiple rounded modular information sections - Clear title hierarchies and key labels - Concise yet rich encyclopedic content - Visual ratings, key point summaries, or Top 5 modules Content columns should be automatically adapted based on the theme, prioritized from these directions: basic profile, classification information, appearance characteristics, habits/ecology, formation mechanism/structure, growth or use conditions, care or maintenance suggestions, risks and precautions, suitable audience or scenarios, pros and cons comparison, and quick rating cards. Visual requirements: Light-colored clean background, soft color palette, light shadows, exquisite small icons, rounded information boxes, neat layout, high information density but not crowded, good reading experience. The overall result must look like a real science encyclopedia card suitable for publishing, reading, collecting, and serialized production, rather than an advertisement. Please do not make it a regular commercial promotional poster. Highlight the features of "knowledge organization + modular information + illustration-style display."
@alanlovelq
暂无图片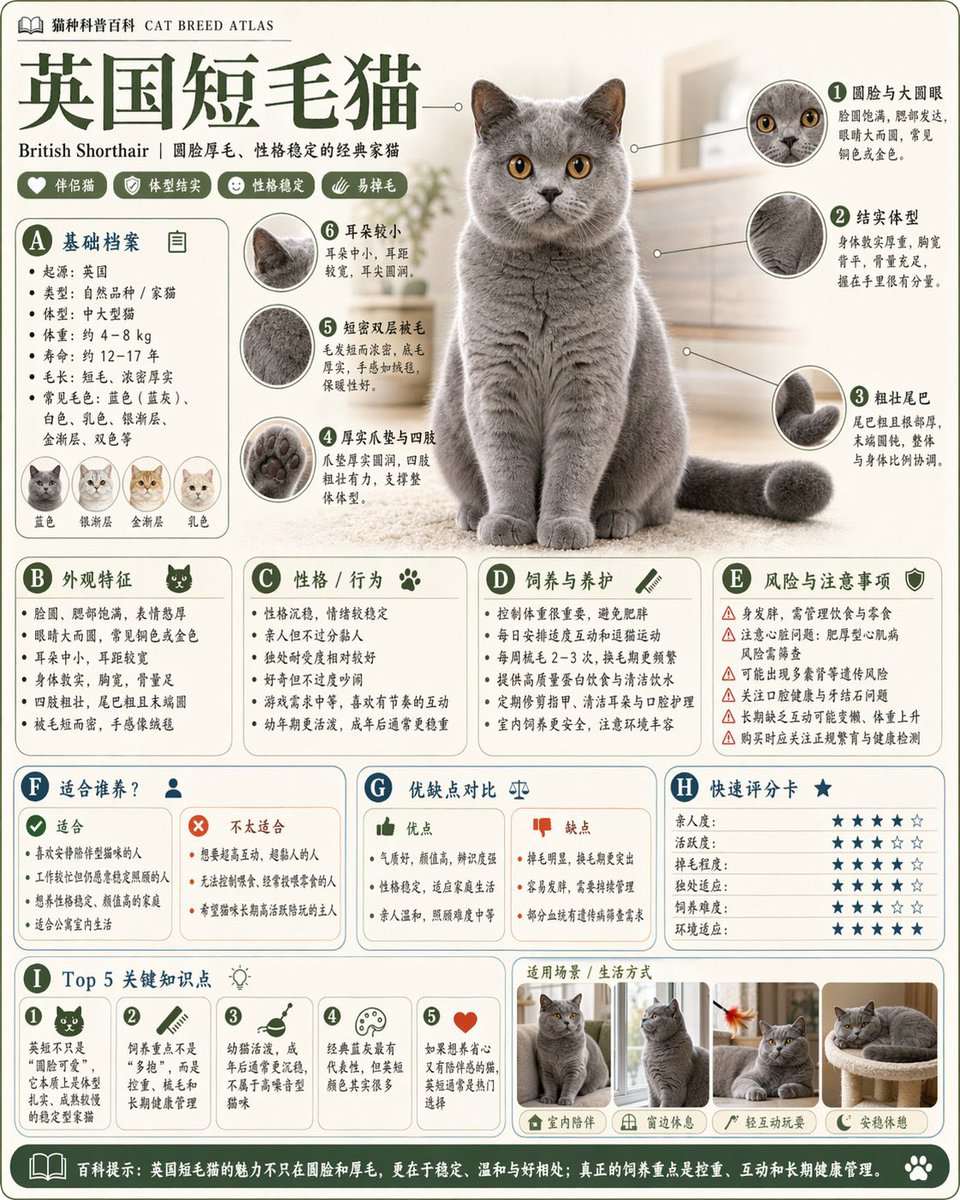
关系图谱信息图
Charts & Infographics
关系图谱信息图
Charts & Infographics
Please generate a high-quality vertical "Popular Science Encyclopedia Image" based on {argument name="theme" default="animals"}. This image is not a regular poster or a simple illustration, but a modular popular science infographic that possesses a sense of "illustration book, encyclopedia, information structure, and collectability." The overall style should reference a combination of high-end natural history illustrations, modern encyclopedia pages, lifestyle knowledge cards, and highly shareable social media infographics. Please include in the frame: - A clear and beautiful main visual of the subject - Several magnified details of local characteristics - Multiple rounded modular information sections - Clear title hierarchies and key labels - Concise yet rich encyclopedic content - Visual ratings, key point summaries, or Top 5 modules Content columns should be automatically adapted based on the theme, prioritized from these directions: basic profile, classification information, appearance characteristics, habits/ecology, formation mechanism/structure, growth or use conditions, care or maintenance suggestions, risks and precautions, suitable audience or scenarios, pros and cons comparison, and quick rating cards. Visual requirements: Light-colored clean background, soft color palette, light shadows, exquisite small icons, rounded information boxes, neat layout, high information density but not crowded, good reading experience. The overall result must look like a real science encyclopedia card suitable for publishing, reading, collecting, and serialized production, rather than an advertisement. Please do not make it a regular commercial promotional poster. Highlight the features of "knowledge organization + modular information + illustration-style display."
@alanlovelq
暂无图片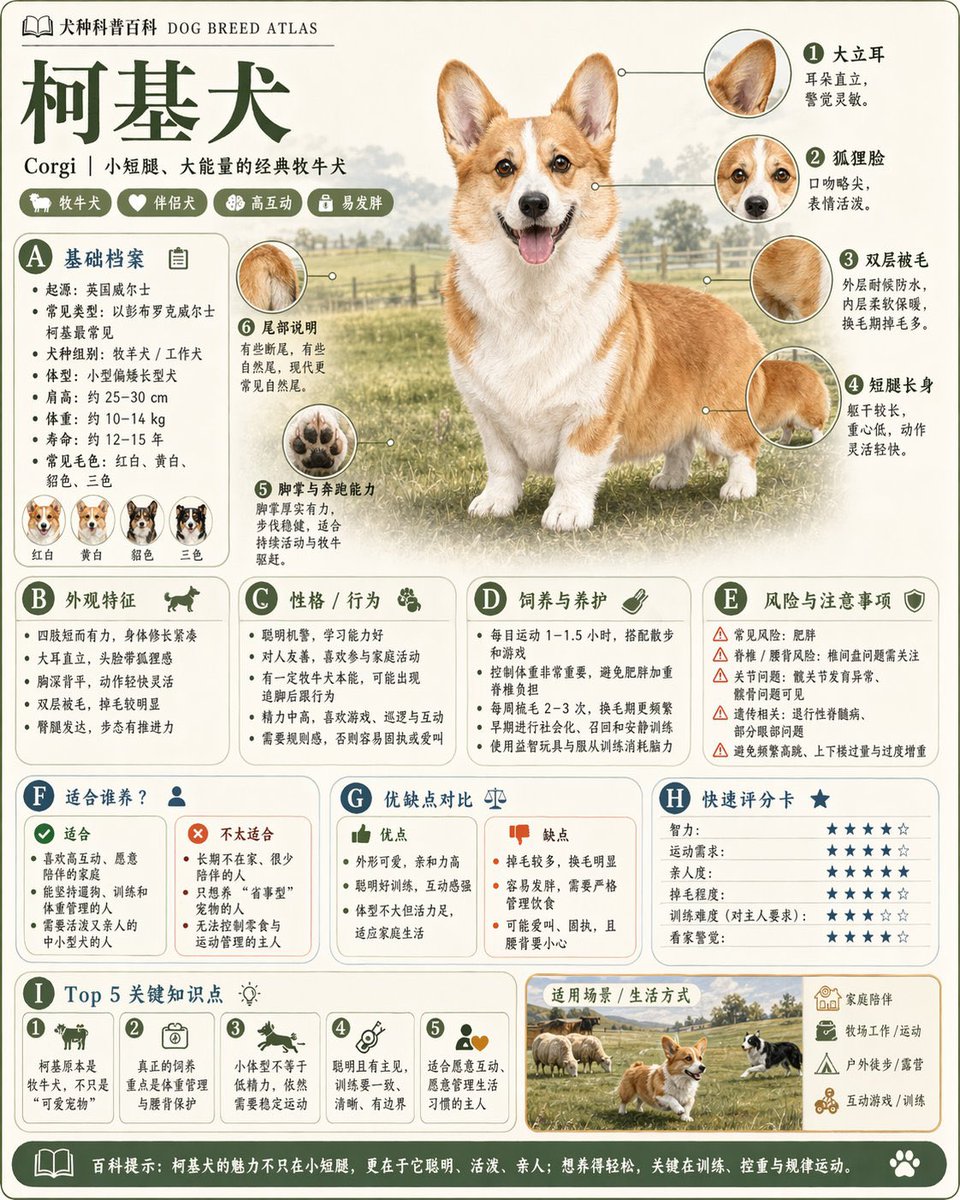
关系图谱信息图
Charts & Infographics
关系图谱信息图
Charts & Infographics
Please generate a high-quality vertical "Popular Science Encyclopedia Image" based on {argument name="theme" default="animals"}. This image is not a regular poster or a simple illustration, but a modular popular science infographic that possesses a sense of "illustration book, encyclopedia, information structure, and collectability." The overall style should reference a combination of high-end natural history illustrations, modern encyclopedia pages, lifestyle knowledge cards, and highly shareable social media infographics. Please include in the frame: - A clear and beautiful main visual of the subject - Several magnified details of local characteristics - Multiple rounded modular information sections - Clear title hierarchies and key labels - Concise yet rich encyclopedic content - Visual ratings, key point summaries, or Top 5 modules Content columns should be automatically adapted based on the theme, prioritized from these directions: basic profile, classification information, appearance characteristics, habits/ecology, formation mechanism/structure, growth or use conditions, care or maintenance suggestions, risks and precautions, suitable audience or scenarios, pros and cons comparison, and quick rating cards. Visual requirements: Light-colored clean background, soft color palette, light shadows, exquisite small icons, rounded information boxes, neat layout, high information density but not crowded, good reading experience. The overall result must look like a real science encyclopedia card suitable for publishing, reading, collecting, and serialized production, rather than an advertisement. Please do not make it a regular commercial promotional poster. Highlight the features of "knowledge organization + modular information + illustration-style display."
@alanlovelq
暂无图片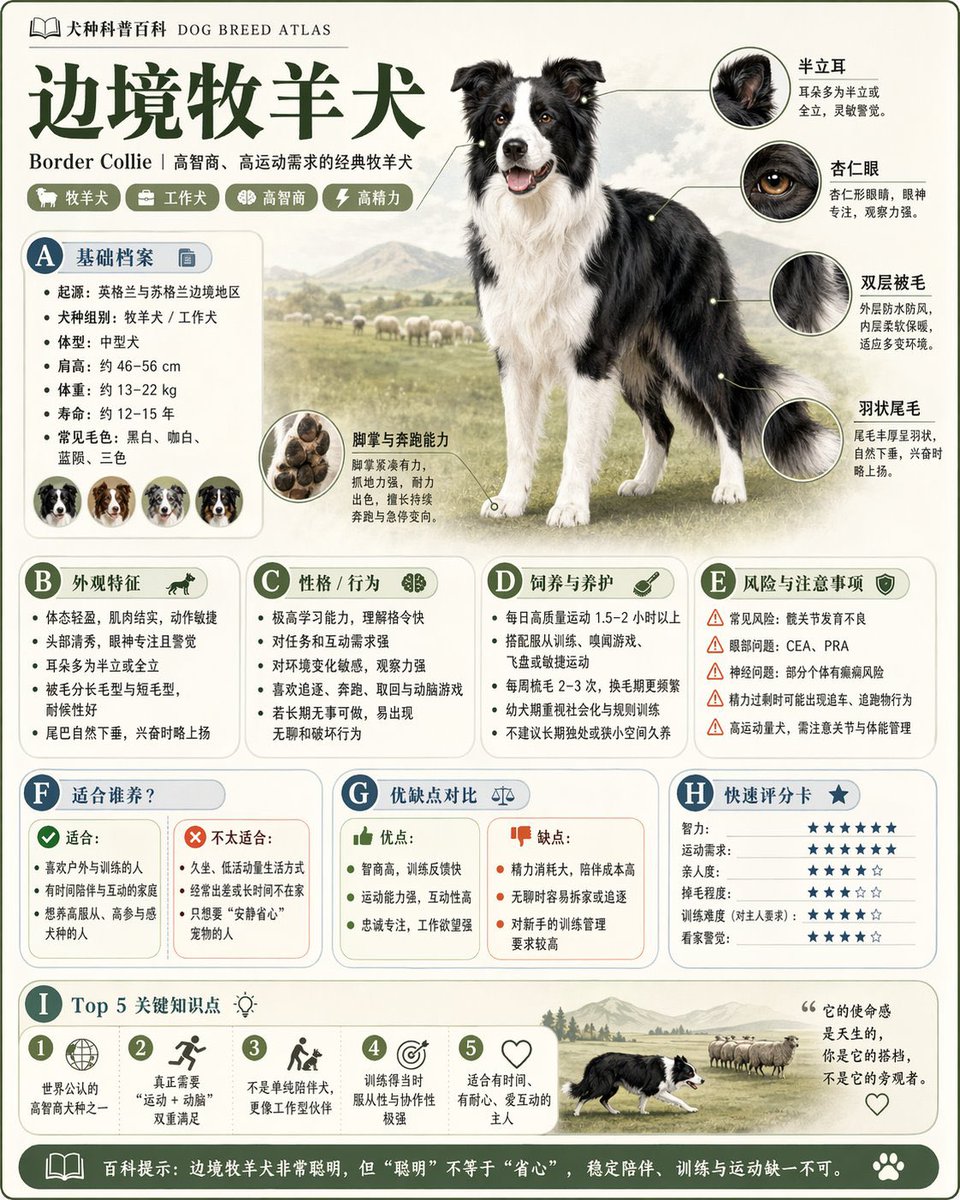
关系图谱信息图
Charts & Infographics
关系图谱信息图
Charts & Infographics
Please generate a high-quality vertical "Popular Science Encyclopedia Image" based on {argument name="theme" default="animals"}. This image is not a regular poster or a simple illustration, but a modular popular science infographic that possesses a sense of "illustration book, encyclopedia, information structure, and collectability." The overall style should reference a combination of high-end natural history illustrations, modern encyclopedia pages, lifestyle knowledge cards, and highly shareable social media infographics. Please include in the frame: - A clear and beautiful main visual of the subject - Several magnified details of local characteristics - Multiple rounded modular information sections - Clear title hierarchies and key labels - Concise yet rich encyclopedic content - Visual ratings, key point summaries, or Top 5 modules Content columns should be automatically adapted based on the theme, prioritized from these directions: basic profile, classification information, appearance characteristics, habits/ecology, formation mechanism/structure, growth or use conditions, care or maintenance suggestions, risks and precautions, suitable audience or scenarios, pros and cons comparison, and quick rating cards. Visual requirements: Light-colored clean background, soft color palette, light shadows, exquisite small icons, rounded information boxes, neat layout, high information density but not crowded, good reading experience. The overall result must look like a real science encyclopedia card suitable for publishing, reading, collecting, and serialized production, rather than an advertisement. Please do not make it a regular commercial promotional poster. Highlight the features of "knowledge organization + modular information + illustration-style display."
@alanlovelq
暂无图片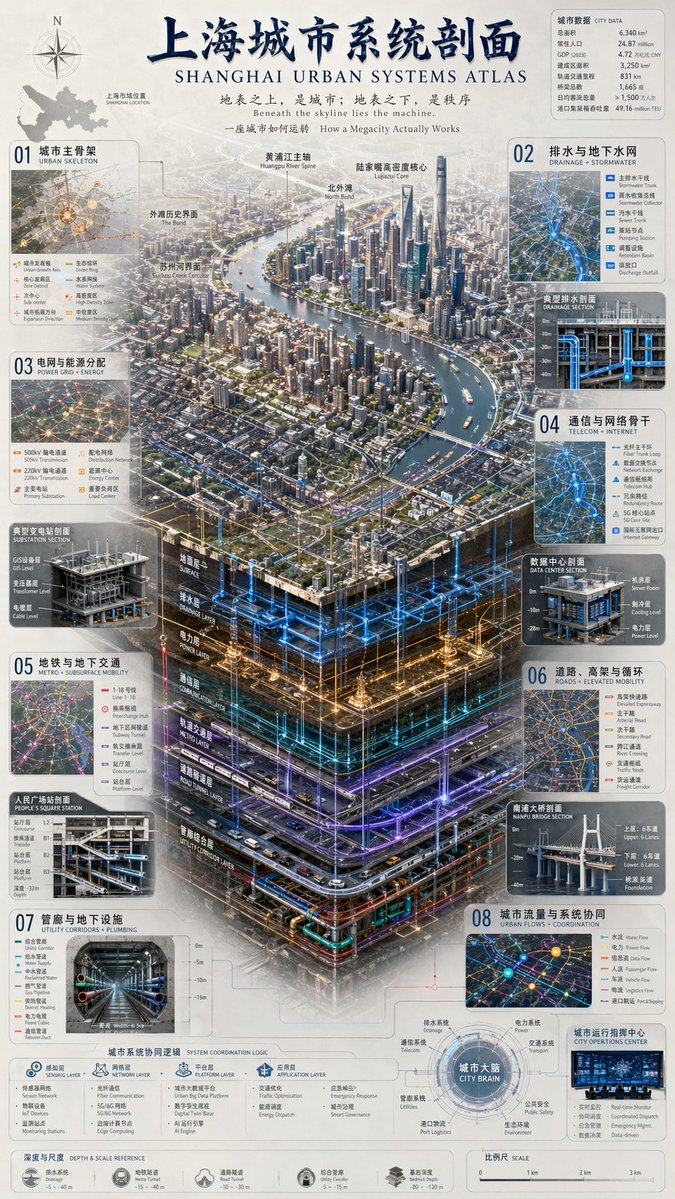
信息图可视化设计
Charts & Infographics
信息图可视化设计
Charts & Infographics
{ "type": "complex urban systems atlas infographic", "style": "{argument name=\"color palette\" default=\"dark background with glowing blue, gold, and purple accents\"}, highly detailed technical illustration, 3D isometric cutaway", "header": { "title": "{argument name=\"chinese city name\" default=\"上海\"}城市系统剖面 {argument name=\"english city name\" default=\"SHANGHAI\"} URBAN SYSTEMS ATLAS", "subtitles": [ "地表之上,是城市;地表之下,是秩序 {argument name=\"english subtitle\" default=\"Beneath the skyline lies the machine.\"}", "一座城市如何运转 How a Megacity Actually Works" ] }, "layout": { "top_left": "Compass rose and city map labeled '上海市域位置 SHANGHAI LOCATION'", "top_right": "Data table titled '城市数据 CITY DATA' with 7 rows of statistics", "centerpiece": { "description": "{argument name=\"centerpiece style\" default=\"highly detailed 3D isometric cutaway render\"} of a megacity river landscape", "layers": [ "地面层 SURFACE", "排水层 DRAINAGE LAYER", "电力层 POWER LAYER", "通信层 COMMUNICATION LAYER", "轨道交通层 METRO LAYER", "道路隧道层 ROAD TUNNEL LAYER", "管廊综合层 UTILITY CORRIDOR LAYER" ] }, "side_panels": [ { "id": "01", "title": "城市主骨架 URBAN SKELETON", "elements": "Map with 8 legend items" }, { "id": "02", "title": "排水与地下水网 DRAINAGE + STORMWATER", "elements": "Cross-section diagram '典型排水剖面 DRAINAGE SECTION' with 5 legend items" }, { "id": "03", "title": "电网与能源分配 POWER GRID + ENERGY", "elements": "Cross-section diagram '典型变电站剖面 SUBSTATION SECTION' with 6 legend items" }, { "id": "04", "title": "通信与网络骨干 TELECOM + INTERNET", "elements": "Cross-section diagram '数据中心剖面 DATA CENTER SECTION' with 6 legend items" }, { "id": "05", "title": "地铁与地下交通 METRO + SUBSURFACE MOBILITY", "elements": "Cross-section diagram '人民广场站剖面 PEOPLE'S SQUARE STATION' with 6 legend items" }, { "id": "06", "title": "道路、高架与循环 ROADS + ELEVATED MOBILITY", "elements": "Cross-section diagram '南浦大桥剖面 NANPU BRIDGE SECTION' with 6 legend items" }, { "id": "07", "title": "管廊与地下设施 UTILITY CORRIDORS + PLUMBING", "elements": "Cross-section diagram '综合管廊 UTILITY CORRIDOR' with 8 legend items" }, { "id": "08", "title": "城市流量与系统协同 URBAN FLOWS + COORDINATION", "elements": "Map diagram '城市运行指挥中心 CITY OPERATIONS CENTER' with 6 legend items" } ], "bottom_panels": { "system_logic": { "title": "城市系统协同逻辑 SYSTEM COORDINATION LOGIC", "steps": 4, "labels": ["感知层 SENSING LAYER", "网络层 NETWORK LAYER", "平台层 PLATFORM LAYER", "应用层 APPLICATION LAYER"] }, "city_brain": { "title": "城市大脑 CITY BRAIN", "central_node": 1, "peripheral_nodes": 8 }, "references": { "depth_scale": { "title": "深度与尺度 DEPTH & SCALE REFERENCE", "icons": 5 }, "map_scale": { "title": "比例尺 SCALE", "markers": 4 } } } } }
@hx831126
暂无图片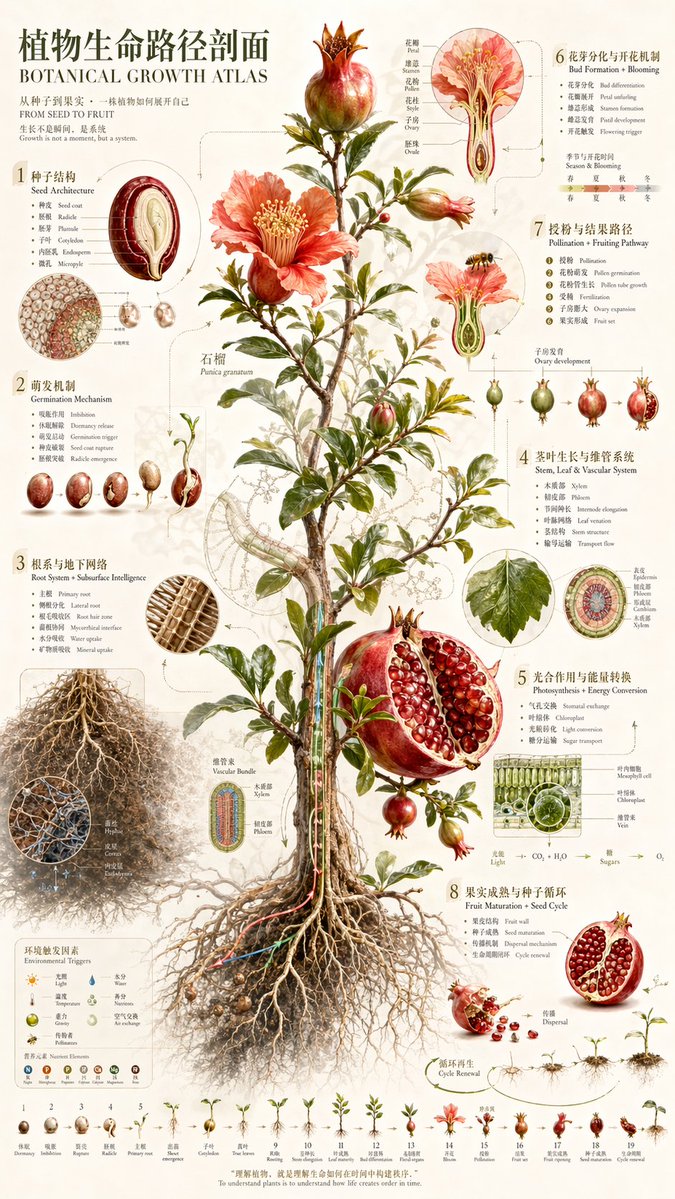
信息图可视化设计
Charts & Infographics
信息图可视化设计
Charts & Infographics
{ "type": "scientific botanical infographic poster", "subject": "{argument name=\"plant species\" default=\"Pomegranate (Punica granatum)\"}", "style": "vintage botanical illustration mixed with modern infographic design, highly detailed, {argument name=\"color palette\" default=\"earthy greens, deep reds, parchment background\"}", "header": { "main_title": "{argument name=\"main title\" default=\"植物生命路径剖面\"}", "english_title": "{argument name=\"english title\" default=\"BOTANICAL GROWTH ATLAS\"}", "subtitle": "从种子到果实,一株植物如何展开自己 / FROM SEED TO FRUIT" }, "centerpiece": "full plant showing extensive root system, woody stem, green leaves, blooming red flowers, and ripe fruits including one halved to show seeds", "layout": { "numbered_sections": [ { "number": 1, "title": "种子结构 / Seed Architecture", "content": "cross-section of a single seed with 6 labeled parts" }, { "number": 2, "title": "萌发机制 / Germination Mechanism", "content": "sequence of 5 sprouting seeds showing radicle emergence" }, { "number": 3, "title": "根系与地下网络 / Root System + Subsurface Intelligence", "content": "detailed root network with 2 circular microscopic cross-sections showing vascular bundles and hyphae" }, { "number": 4, "title": "茎叶生长与维管系统 / Stem, Leaf & Vascular System", "content": "leaf detail and circular stem cross-section with 5 labeled layers" }, { "number": 5, "title": "光合作用与能量转换 / Photosynthesis + Energy Conversion", "content": "3D cellular cross-section of a leaf showing mesophyll and chloroplasts, plus a chemical equation diagram" }, { "number": 6, "title": "花芽分化与开花机制 / Bud Formation + Blooming", "content": "detailed flower cross-section showing stamen and ovary, plus a 4-season timeline" }, { "number": 7, "title": "授粉与结果路径 / Pollination + Fruiting Pathway", "content": "bee approaching a flower cross-section, followed by a sequence of 5 stages of ovary development into a fruit" }, { "number": 8, "title": "果实成熟与种子循环 / Fruit Maturation + Seed Cycle", "content": "ripe fruit breaking open, seeds dispersing downwards to a new sprout" } ], "additional_elements": [ { "position": "bottom left", "title": "环境触发因素 / Environmental Triggers", "content": "grid of 6 weather/environmental icons and 6 nutrient element icons (N, P, K, Ca, Mg, Fe)" }, { "position": "bottom edge", "title": "Growth Timeline", "content": "linear sequence of 19 small plant icons showing the complete life cycle from seed to mature plant" } ], "footer_quote": "{argument name=\"bottom quote\" default=\"理解植物,就是理解生命如何在时间中构建秩序。\"}" } }
@hx831126
暂无图片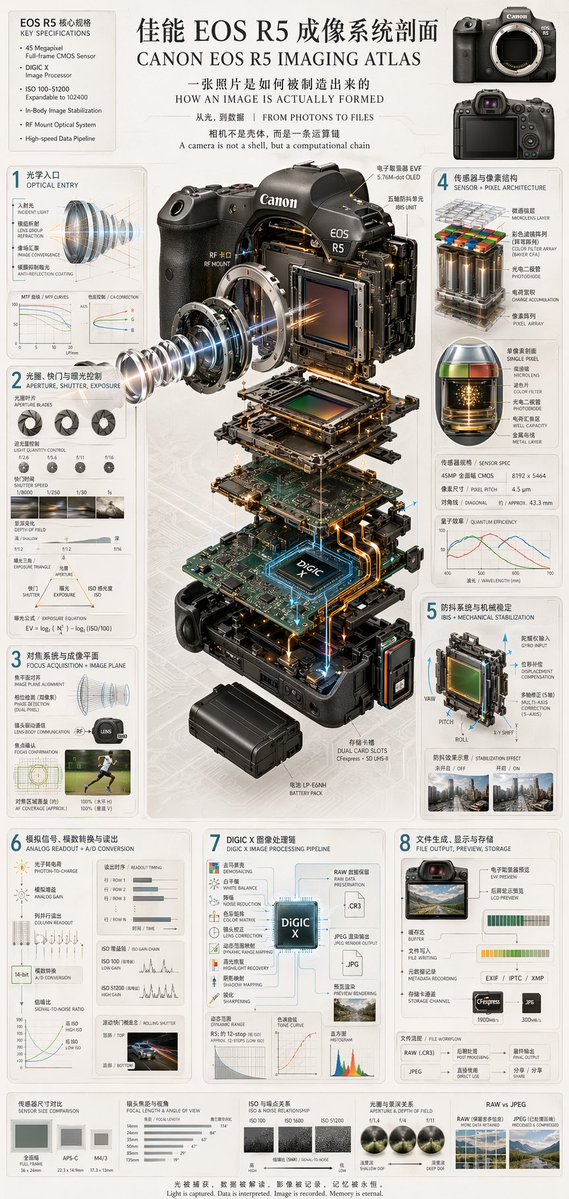
关系图谱信息图
Charts & Infographics
关系图谱信息图
Charts & Infographics
{ "type": "technical infographic and exploded view diagram", "header": { "title": "{argument name=\"main title\" default=\"佳能 EOS R5 成像系统剖面 CANON EOS R5 IMAGING ATLAS\"}", "subtitles": [ "一张照片是如何被制造出来的 HOW AN IMAGE IS ACTUALLY FORMED", "从光,到数据 | FROM PHOTONS TO FILES", "相机不是壳体,而是一条运算链 A camera is not a shell, but a computational chain" ], "top_left_box": { "title": "EOS R5 核心规格 KEY SPECIFICATIONS", "bullet_points_count": 6 }, "top_right_images": { "count": 2, "description": "front and back views of the camera body" } }, "centerpiece": { "description": "highly detailed 3D exploded view of the {argument name=\"camera model\" default=\"Canon EOS R5\"} camera, showing internal components separated vertically", "components_visible": [ "lens mount", "lens elements with glowing blue light rays", "image sensor", "motherboard with glowing {argument name=\"processor name\" default=\"DIGIC X\"} chip", "battery pack", "dual card slots", "electronic viewfinder (EVF)" ] }, "layout": { "numbered_sections": [ { "number": 1, "title": "光学入口 OPTICAL ENTRY", "elements": ["lens cross-section with light rays", "2 line graphs"] }, { "number": 2, "title": "光圈、快门与曝光控制 APERTURE, SHUTTER, EXPOSURE", "elements": ["3 aperture blade diagrams", "4 shutter speed example photos", "depth of field diagram", "exposure triangle diagram"] }, { "number": 3, "title": "对焦系统与成像平面 FOCUS ACQUISITION + IMAGE PLANE", "elements": ["lens alignment diagram", "AF coverage photo of a runner"] }, { "number": 4, "title": "传感器与像素结构 SENSOR + PIXEL ARCHITECTURE", "elements": ["3D pixel array diagram", "single pixel cross-section diagram", "sensor spec table", "quantum efficiency graph"] }, { "number": 5, "title": "防抖系统与机械稳定 IBIS + MECHANICAL STABILIZATION", "elements": ["sensor shift mechanism diagram with yaw/pitch/roll axes", "2 stabilization effect comparison photos"] }, { "number": 6, "title": "模拟信号、模数转换与读出 ANALOG READOUT + A/D CONVERSION", "elements": ["signal flowchart", "3 readout timing graphs", "signal-to-noise ratio graph", "rolling shutter example photo of a car"] }, { "number": 7, "title": "DIGIC X 图像处理链 DIGIC X IMAGE PROCESSING PIPELINE", "elements": ["processing flowchart with central chip", "dynamic range graph", "tone curve graph", "histogram"] }, { "number": 8, "title": "文件生成、显示与存储 FILE OUTPUT, PREVIEW, STORAGE", "elements": ["file output flowchart", "2 storage card icons", "file workflow diagram"] } ], "bottom_comparisons": { "count": 5, "labels": [ "传感器尺寸对比 SENSOR SIZE COMPARISON", "镜头焦距与视角 FOCAL LENGTH & ANGLE OF VIEW", "ISO 与噪点关系 ISO & NOISE RELATIONSHIP", "光圈与景深关系 APERTURE & DEPTH OF FIELD", "RAW vs JPEG" ] }, "footer": "{argument name=\"footer quote\" default=\"光被捕获,数据被解读,影像被记录,记忆被永恒。 Light is captured. Data is interpreted. Image is recorded. Memory is eternal.\"}" }, "style": "clean, technical, highly detailed, photorealistic components, blueprint-style annotations, light gray background, precise typography" }
@hx831126
暂无图片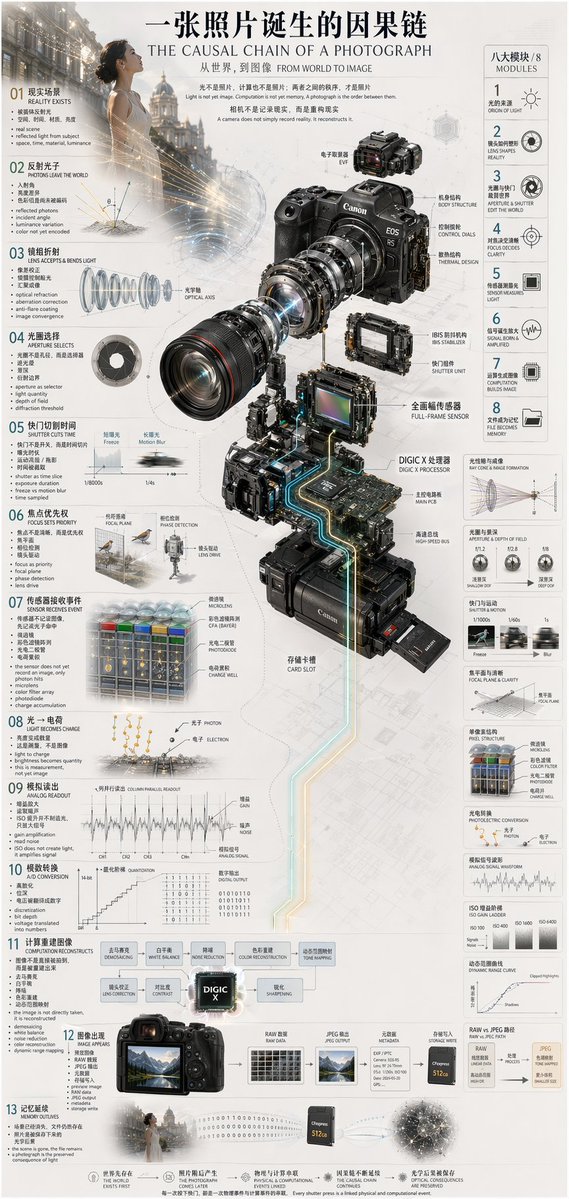
信息图可视化设计
Charts & Infographics
信息图可视化设计
Charts & Infographics
{ "type": "technical infographic", "subject": "{argument name=\"subject matter\" default=\"digital photography process\"}", "header": { "title": "{argument name=\"main title\" default=\"一张照片诞生的因果链 THE CAUSAL CHAIN OF A PHOTOGRAPH\"}", "subtitle": "从世界,到图像 FROM WORLD TO IMAGE" }, "centerpiece": { "description": "Exploded isometric view of a modern mirrorless camera", "model": "{argument name=\"camera model\" default=\"Canon EOS R5\"}", "labeled_parts_count": 12, "labeled_parts": [ "EVF", "Body Structure", "Control Dials", "Thermal Design", "Optical Axis", "IBIS Stabilizer", "Shutter Unit", "Full-Frame Sensor", "{argument name=\"processor name\" default=\"DIGIC X Processor\"}", "Main PCB", "High-Speed Bus", "Card Slot" ] }, "layout": { "left_column": { "description": "Chronological causal chain", "count": 13, "steps": [ "01 REALITY EXISTS", "02 PHOTONS LEAVE THE WORLD", "03 LENS ACCEPTS & BENDS LIGHT", "04 APERTURE SELECTS", "05 SHUTTER CUTS TIME", "06 FOCUS SETS PRIORITY", "07 SENSOR RECEIVES EVENT", "08 LIGHT BECOMES CHARGE", "09 ANALOG READOUT", "10 A/D CONVERSION", "11 COMPUTATION RECONSTRUCTS", "12 IMAGE APPEARS", "13 MEMORY OUTLIVES" ] }, "right_column": { "title": "八大模块 / 8 MODULES", "count": 8, "modules": [ "1 ORIGIN OF LIGHT", "2 LENS SHAPES REALITY", "3 APERTURE & SHUTTER EDIT THE WORLD", "4 FOCUS DECIDES CLARITY", "5 SENSOR MEASURES LIGHT", "6 SIGNAL BORN & AMPLIFIED", "7 COMPUTATION BUILDS IMAGE", "8 FILE BECOMES MEMORY" ] }, "side_diagrams": { "count": 7, "descriptions": [ "Ray cone & image formation", "Aperture & depth of field", "Shutter & motion", "Focal plane & clarity", "Pixel structure", "Photoelectric conversion", "Analog signal waveform" ] }, "footer": { "count": 5, "description": "Philosophical summary points" } }, "style": "technical, precise, wireframe elements, glowing data lines, photorealistic camera components, clean typography, dual-language" }
@hx831126
暂无图片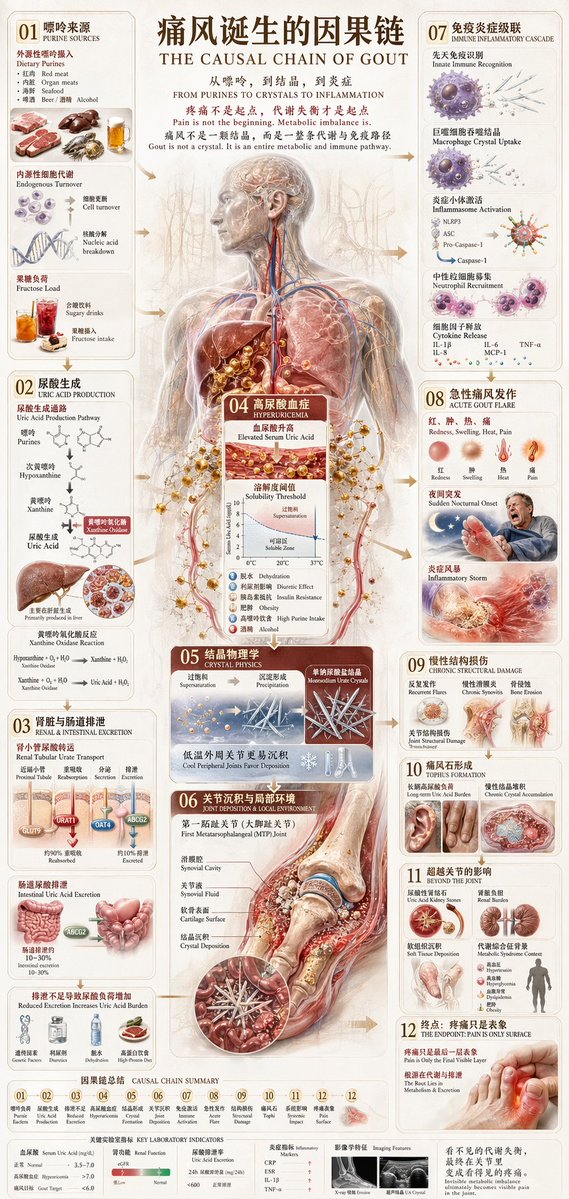
信息图可视化设计
Charts & Infographics
信息图可视化设计
Charts & Infographics
{ "type": "comprehensive medical infographic", "style": "highly detailed 3D medical illustration, clinical white background, clean typography", "header": { "title_cn": "{argument name=\"main title\" default=\"痛风诞生的因果链\"}", "title_en": "{argument name=\"english title\" default=\"THE CAUSAL CHAIN OF GOUT\"}", "subtitle": "Pain is not the beginning. Metabolic imbalance is.", "top_right_sequence": { "count": 6, "labels": ["Metabolism", "Transport", "Crystallization", "Immunity", "Inflammation", "Damage"] } }, "centerpiece": { "description": "{argument name=\"central figure\" default=\"transparent anatomical human body showing liver, kidneys, and vascular system\"}", "details": "pathway highlighted in {argument name=\"highlight color\" default=\"glowing red\"} descending to the foot" }, "layout": { "left_column": [ { "id": "01", "title": "Purine Sources", "elements": 6, "labels": ["Red meat", "Organ meats", "Seafood", "Beer", "Endogenous", "Fructose"] }, { "id": "02", "title": "Uric Acid Production", "elements": 2, "labels": ["Chemical pathway", "Liver"] }, { "id": "03", "title": "Renal & Intestinal Excretion", "elements": 2, "labels": ["Kidney nephron", "Intestines"] }, { "id": "04", "title": "Hyperuricemia", "elements": 2, "labels": ["Blood vial", "Solubility graph"] } ], "center_overlay": [ { "id": "05", "title": "Crystal Physics", "elements": 3, "labels": ["Supersaturation beaker", "Precipitation beaker", "Molecular structure"] }, { "id": "06", "title": "Joint Deposition & Local Environment", "elements": 1, "labels": ["First MTP joint cross-section"] } ], "right_column": [ { "id": "07", "title": "Immune Inflammatory Cascade", "elements": 4, "labels": ["Macrophage", "Inflammasome", "Neutrophil", "Cytokines"] }, { "id": "08", "title": "Acute Gout Flare", "elements": 1, "labels": ["Inflamed foot"] }, { "id": "09", "title": "Chronic Structural Damage", "elements": 1, "labels": ["Bone erosion joint"] }, { "id": "10", "title": "Tophus Formation", "elements": 2, "labels": ["Hand tophi", "Foot tophi"] }, { "id": "11", "title": "Beyond the Joint", "elements": 2, "labels": ["Kidney stones", "Systemic burden"] } ], "bottom_row": [ { "id": "12", "title": "Pain Is the Final Signal", "elements": 7, "labels": ["Increased Purine", "Overproduction", "Reduced Excretion", "Hyperuricemia", "Crystal Formation", "Immune Activation", "Man in pain"] } ] }, "theme": "{argument name=\"disease focus\" default=\"gout and uric acid crystallization\"}" }
@hx831126
暂无图片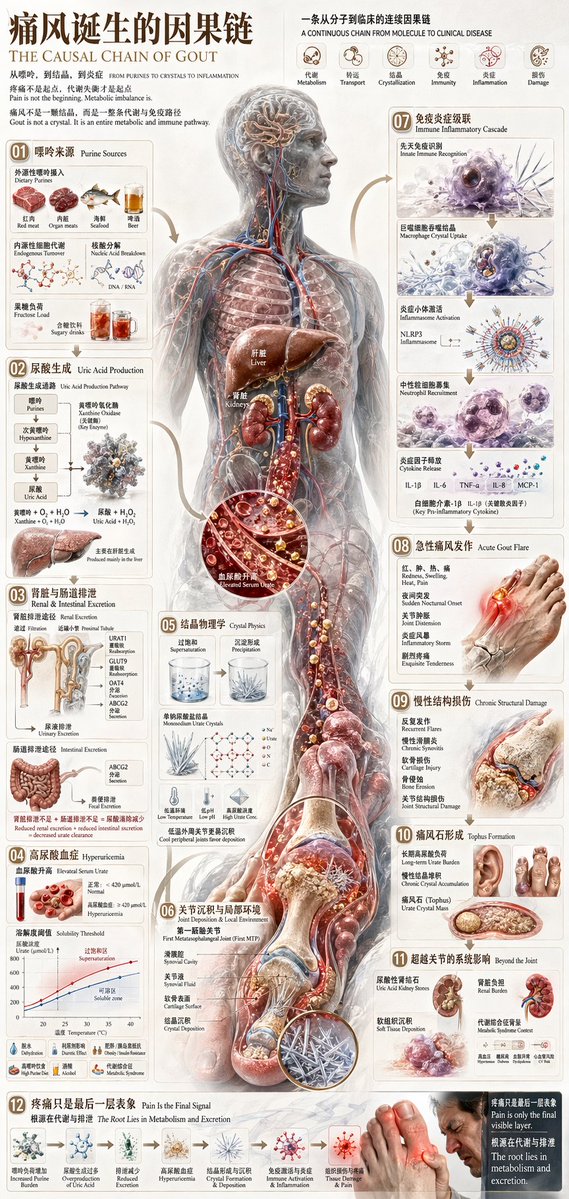
信息图可视化设计
Charts & Infographics
信息图可视化设计
Charts & Infographics
{ "type": "comprehensive medical infographic", "style": "highly detailed 3D medical illustration, clinical white background, clean typography", "header": { "title_cn": "{argument name=\"main title\" default=\"痛风诞生的因果链\"}", "title_en": "{argument name=\"english title\" default=\"THE CAUSAL CHAIN OF GOUT\"}", "subtitle": "Pain is not the beginning. Metabolic imbalance is.", "top_right_sequence": { "count": 6, "labels": ["Metabolism", "Transport", "Crystallization", "Immunity", "Inflammation", "Damage"] } }, "centerpiece": { "description": "{argument name=\"central figure\" default=\"transparent anatomical human body showing liver, kidneys, and vascular system\"}", "details": "pathway highlighted in {argument name=\"highlight color\" default=\"glowing red\"} descending to the foot" }, "layout": { "left_column": [ { "id": "01", "title": "Purine Sources", "elements": 6, "labels": ["Red meat", "Organ meats", "Seafood", "Beer", "Endogenous", "Fructose"] }, { "id": "02", "title": "Uric Acid Production", "elements": 2, "labels": ["Chemical pathway", "Liver"] }, { "id": "03", "title": "Renal & Intestinal Excretion", "elements": 2, "labels": ["Kidney nephron", "Intestines"] }, { "id": "04", "title": "Hyperuricemia", "elements": 2, "labels": ["Blood vial", "Solubility graph"] } ], "center_overlay": [ { "id": "05", "title": "Crystal Physics", "elements": 3, "labels": ["Supersaturation beaker", "Precipitation beaker", "Molecular structure"] }, { "id": "06", "title": "Joint Deposition & Local Environment", "elements": 1, "labels": ["First MTP joint cross-section"] } ], "right_column": [ { "id": "07", "title": "Immune Inflammatory Cascade", "elements": 4, "labels": ["Macrophage", "Inflammasome", "Neutrophil", "Cytokines"] }, { "id": "08", "title": "Acute Gout Flare", "elements": 1, "labels": ["Inflamed foot"] }, { "id": "09", "title": "Chronic Structural Damage", "elements": 1, "labels": ["Bone erosion joint"] }, { "id": "10", "title": "Tophus Formation", "elements": 2, "labels": ["Hand tophi", "Foot tophi"] }, { "id": "11", "title": "Beyond the Joint", "elements": 2, "labels": ["Kidney stones", "Systemic burden"] } ], "bottom_row": [ { "id": "12", "title": "Pain Is the Final Signal", "elements": 7, "labels": ["Increased Purine", "Overproduction", "Reduced Excretion", "Hyperuricemia", "Crystal Formation", "Immune Activation", "Man in pain"] } ] }, "theme": "{argument name=\"disease focus\" default=\"gout and uric acid crystallization\"}" }
@hx831126
暂无图片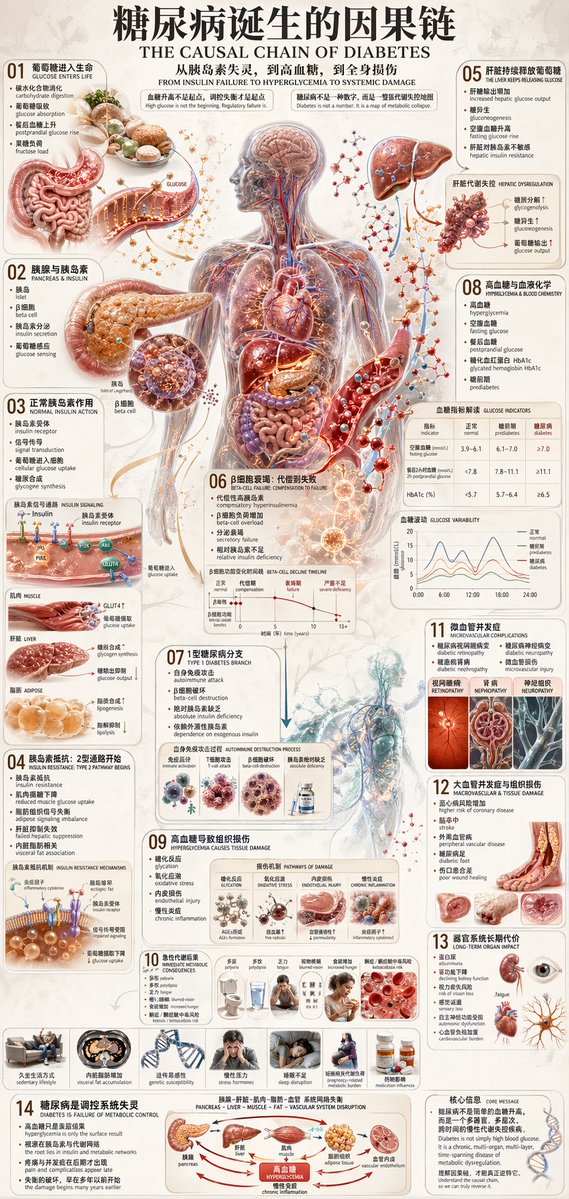
信息图可视化设计
Charts & Infographics
信息图可视化设计
Charts & Infographics
{ "type": "medical infographic poster", "style": "highly detailed anatomical illustrations, clean structured layout, scientific diagrammatic style", "color_palette": "{argument name=\"color palette\" default=\"medical red, blue, beige, and anatomical flesh tones\"}", "language": "{argument name=\"language\" default=\"bilingual Chinese and English\"}", "header": { "main_title": "{argument name=\"main title\" default=\"糖尿病诞生的因果链\"}", "english_title": "{argument name=\"english title\" default=\"THE CAUSAL CHAIN OF DIABETES\"}", "subtitle": "从胰岛素失灵,到高血糖,到全身损伤" }, "layout": { "centerpiece": "{argument name=\"central subject\" default=\"transparent human body showing circulatory system and internal organs\"}", "sections_count": 14, "sections": [ { "id": "01", "title": "葡萄糖进入生命", "visuals": ["stomach and intestines"] }, { "id": "02", "title": "胰腺与胰岛素", "visuals": ["pancreas", "beta cell"] }, { "id": "03", "title": "正常胰岛素作用", "visuals": ["receptor signaling diagram", "muscle, liver, adipose icons"] }, { "id": "04", "title": "胰岛素抵抗: 2型通路开始", "visuals": ["receptor blockage diagram", "7 lifestyle icons"] }, { "id": "05", "title": "肝脏持续释放葡萄糖", "visuals": ["liver"] }, { "id": "06", "title": "β细胞衰竭: 代偿到失败", "visuals": ["beta-cell decline line chart"] }, { "id": "07", "title": "1型糖尿病分支", "visuals": ["autoimmune destruction diagram"] }, { "id": "08", "title": "高血糖与血液化学", "visuals": ["blood vessel with glucose", "glucose indicators table", "glucose variability chart"] }, { "id": "09", "title": "高血糖导致组织损伤", "visuals": ["4 pathways of damage diagrams"] }, { "id": "10", "title": "急性代谢后果", "visuals": ["7 symptom icons"] }, { "id": "11", "title": "微血管并发症", "visuals": ["eye", "kidney", "nerve cross-section"] }, { "id": "12", "title": "大血管并发症与组织损伤", "visuals": ["heart", "brain", "diabetic foot"] }, { "id": "13", "title": "器官系统长期代价", "visuals": ["text list"] }, { "id": "14", "title": "糖尿病是调控系统失灵", "visuals": ["metabolic control flowchart"] } ], "footer": { "core_message": "核心信息 CORE MESSAGE" } } }
@hx831126
暂无图片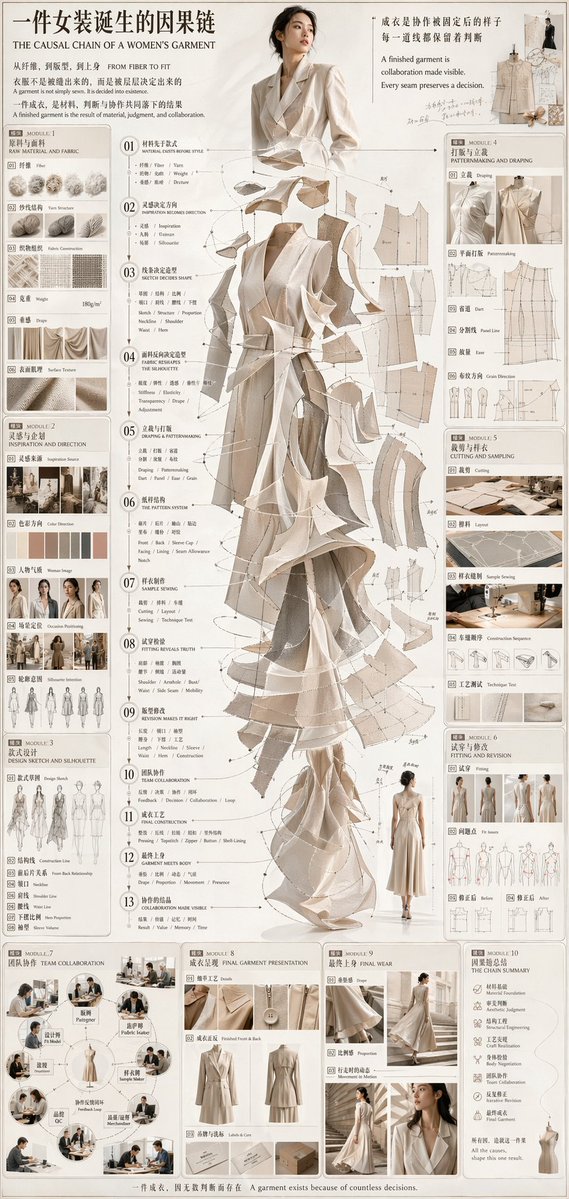
信息图可视化设计
Charts & Infographics
信息图可视化设计
Charts & Infographics
{ "type": "fashion design process infographic", "title": "{argument name=\"main title\" default=\"一件女装诞生的因果链 THE CAUSAL CHAIN OF A WOMEN'S GARMENT\"}", "subtitle": "从纤维,到版型,到上身 FROM FIBER TO FIT", "style": { "aesthetic": "elegant editorial, technical fashion illustration, highly detailed", "color_palette": "{argument name=\"color palette\" default=\"beige, cream, and neutral tones\"}" }, "layout": { "centerpiece": { "description": "Exploded-view illustration of a {argument name=\"garment type\" default=\"women's trench coat dress\"} showing cascading layers of fabric, pattern pieces, and stitching lines. Top shows a model wearing the finished garment.", "central_list": { "count": 13, "type": "numbered steps with pointer lines", "labels": ["01 Material", "02 Inspiration", "03 Sketch", "04 Fabric", "05 Draping", "06 Pattern", "07 Sewing", "08 Fitting", "09 Revision", "10 Team", "11 Construction", "12 Garment", "13 Collaboration"] } }, "left_column": [ { "module": "MODULE 1: RAW MATERIAL AND FABRIC", "count": 6, "items": ["Fiber", "Yarn Structure", "Fabric Construction", "Weight", "Drape", "Surface Texture"] }, { "module": "MODULE 2: INSPIRATION AND DIRECTION", "count": 5, "items": ["Inspiration Source", "Color Direction", "Woman Image", "Occasion Positioning", "Silhouette Intention"] }, { "module": "MODULE 3: DESIGN SKETCH AND SILHOUETTE", "count": 7, "items": ["Design Sketch", "Construction Line", "Front Back Relationship", "Neckline", "Shoulder Line", "Waist Line", "Hem Proportion"] } ], "right_column": [ { "module": "MODULE 4: PATTERNMAKING AND DRAPING", "count": 6, "items": ["Draping", "Patternmaking", "Dart", "Panel Line", "Ease", "Grain Direction"] }, { "module": "MODULE 5: CUTTING AND SAMPLING", "count": 5, "items": ["Cutting", "Layout", "Sample Sewing", "Construction Sequence", "Technique Test"] }, { "module": "MODULE 6: FITTING AND REVISION", "count": 4, "items": ["Fitting", "Fit Issues", "Before", "After"] } ], "bottom_row": [ { "module": "MODULE 7: TEAM COLLABORATION", "count": 8, "items": ["Designer", "Patternmaker", "Fabric Buyer", "Sample Maker", "Merchandiser", "QC", "Feedback Loop", "Model"] }, { "module": "MODULE 8: FINAL GARMENT PRESENTATION", "count": 3, "items": ["Details", "Finished Front & Back", "Labels & Care"] }, { "module": "MODULE 9: FINAL WEAR", "count": 3, "items": ["Drape", "Proportion", "Movement in Motion"] }, { "module": "MODULE 10: THE CHAIN SUMMARY", "count": 8, "items": ["Material Foundation", "Aesthetic Judgment", "Structural Engineering", "Craft Realization", "Body Negotiation", "Team Collaboration", "Iterative Revision", "Final Garment"] } ], "footer": "{argument name=\"footer text\" default=\"一件成衣,因无数判断而存在 A garment exists because of countless decisions.\"}" } }
@hx831126
暂无图片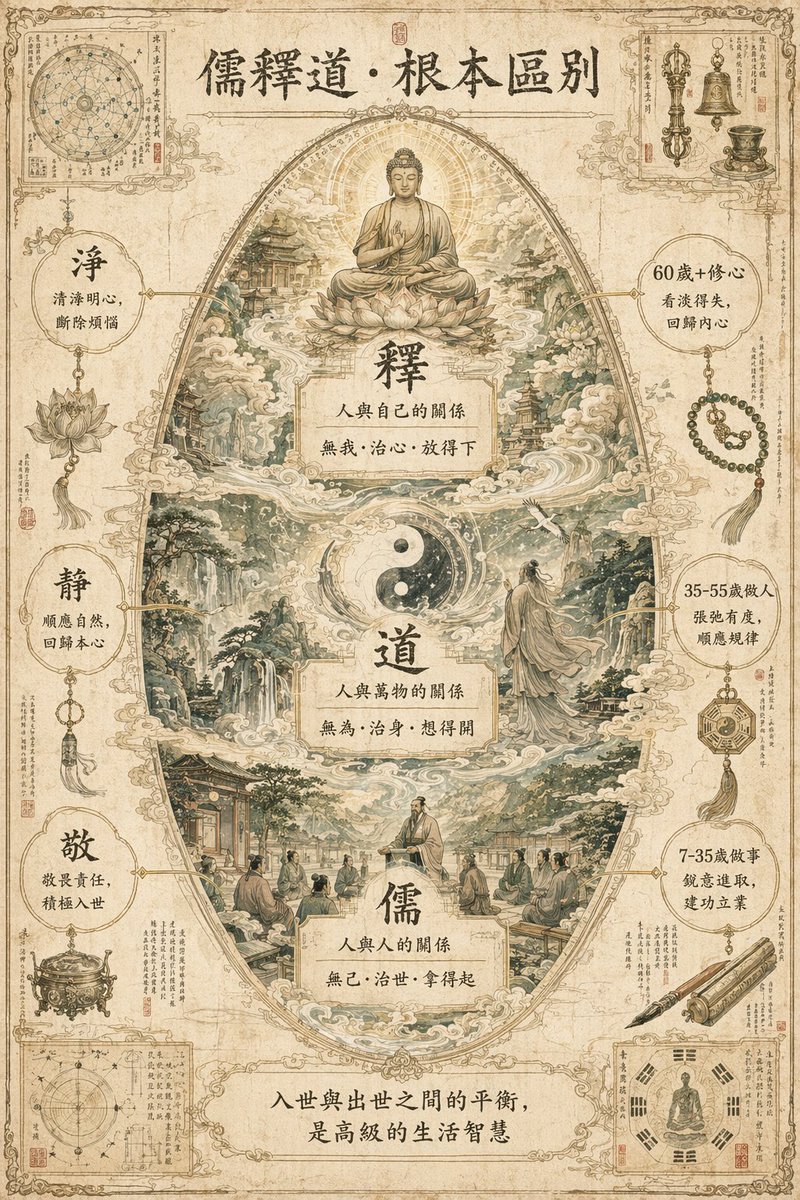
信息图可视化设计
Charts & Infographics
信息图可视化设计
Charts & Infographics
A breathtaking and extremely complex world-building infographic masterpiece conceptualizing the "{argument name="theme" default="Fundamental Differences between Confucianism, Buddhism, and Taoism"}", designed as a profound {argument name="style" default="ancient Oriental mythological manuscript"}. Background: Pure white vintage textured canvas with a light beige aged parchment base color, subtle frayed edges, and water stain textures. Core Layout: Central vision uses a grand "vertical egg-shaped layered structure", with Buddhism, Taoism, and Confucianism layers from top to bottom. Margins: Four corners are decorated with fine micro-illustrations featuring ancient observation notes, ritual implements, and runes. Colors: Low-saturation sage green, light gold, and off-white as main tones; overall light and soft without harsh high-saturation colors. Details: Architectural lines, landscape brushwork, lotus patterns, and cloud layers are clearly visible and exquisitely detailed. Seamless Fusion: The three layers transition naturally through clouds and flowing water; the Buddhist halo, Taoist Taiji mist, and Confucian scholarly aura connect seamlessly. Style: Classical ink line art + low-saturation digital watercolor, with a light Chinese-style ancient book manuscript texture. Text Annotations: Authentic Traditional Chinese characters in a mottled vintage Song typeface. Each annotation includes a short title + a line of poetic description, connected to corresponding details by dark gold hair-thin lines with no overlapping pointers. Aspect Ratio: {argument name="aspect ratio" default="3:4"} vertical format, independent and complete. Title Area (Top): `儒釋道·根本區別` (Confucianism, Buddhism, Taoism: Fundamental Differences) Central Layer Labels: Top "Buddhism": `釋`, `Relationship between man and self`, `Selflessness, governing the heart, letting go` Middle "Taoism": `道`, `Relationship between man and all things`, `Non-action, governing the body, being open-minded` Bottom "Confucianism": `儒`, `Relationship between man and man`, `No ego, governing the world, taking responsibility` Side Annotations: Left: `Purity`: pure heart and clear mind, cutting off troubles; `Stillness`: following nature, returning to the original heart; `Respect`: respecting responsibility, active involvement in society. Right: `60+ Spiritual Cultivation`: looking lightly at gain/loss; `35-55 Conduct`: living with flexibility, following laws; `7-35 Actions`: forging ahead, building careers. Bottom Summary: `The balance between being in the world and being out of the world is high-level life wisdom.`
@GeekCatX
暂无图片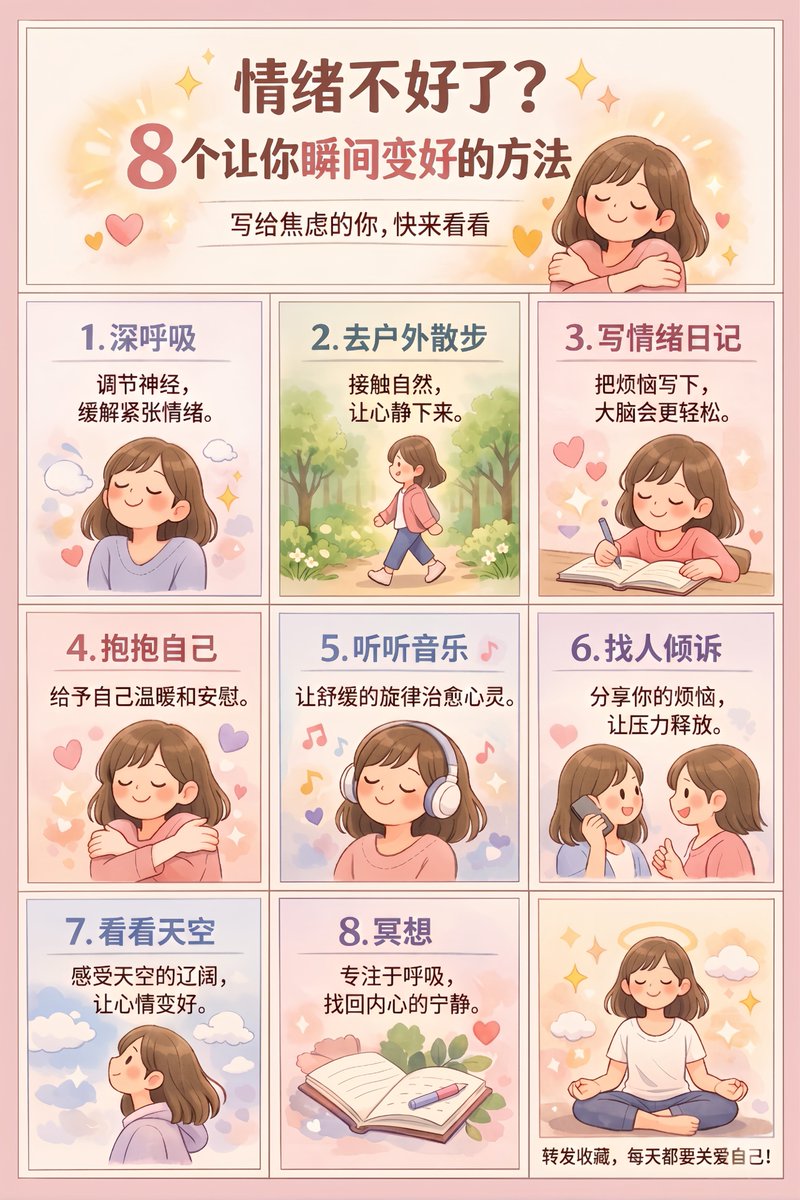
信息图可视化设计
Charts & Infographics
信息图可视化设计
Charts & Infographics
{"type":"infographic poster","style":"cute flat vector illustration, cozy, warm, soft shading, {argument name=\"color palette\" default=\"pastel Morandi colors, soft pinks, purples, and warm tones\"}","character":"{argument name=\"character description\" default=\"young woman with shoulder-length brown hair wearing a pinkish-purple shirt\"}","layout":{"structure":"4 rows, 3 columns. Top row is a merged header. Rows 2-4 contain 9 individual panels.","header":{"title":"{argument name=\"main title\" default=\"情绪不好了?\"}","subtitle":"{argument name=\"subtitle\" default=\"8个让你瞬间变好的方法\"}","sub_subtitle":"写给焦虑的你,快来看看","visual":"character hugging herself, surrounded by yellow sparkles and hearts"},"grid_panels":[{"id":1,"title":"1. 深呼吸","text":"调节神经,缓解紧张情绪。","visual":"character with eyes closed, smiling, surrounded by clouds"},{"id":2,"title":"2. 去户外散步","text":"接触自然,让心静下来。","visual":"character walking outdoors among green trees and bushes"},{"id":3,"title":"3. 写情绪日记","text":"把烦恼写下,大脑会更轻松。","visual":"character sitting at a desk writing in a notebook with a pen, floating hearts"},{"id":4,"title":"4. 抱抱自己","text":"给予自己温暖和安慰。","visual":"character hugging herself with eyes closed, floating hearts"},{"id":5,"title":"5. 听听音乐","text":"让舒缓的旋律治愈心灵。","visual":"character wearing large white headphones, eyes closed, floating colorful music notes"},{"id":6,"title":"6. 找人倾诉","text":"分享你的烦恼,让压力释放。","visual":"character holding a smartphone, talking to another similar-looking girl, floating hearts"},{"id":7,"title":"7. 看看天空","text":"感受天空的辽阔,让心情变好。","visual":"character looking up at a blue sky with white clouds and sparkles"},{"id":8,"title":"8. 冥想","text":"专注于呼吸,找回内心的宁静。","visual":"an open notebook, a pen, and a pink flower on a desk"},{"id":9,"title":"none","text":"{argument name=\"footer text\" default=\"转发收藏,每天都要关爱自己!\"}","visual":"character sitting cross-legged in a meditation pose, eyes closed, with a glowing halo behind her head"}]}}
@j_zou93
暂无图片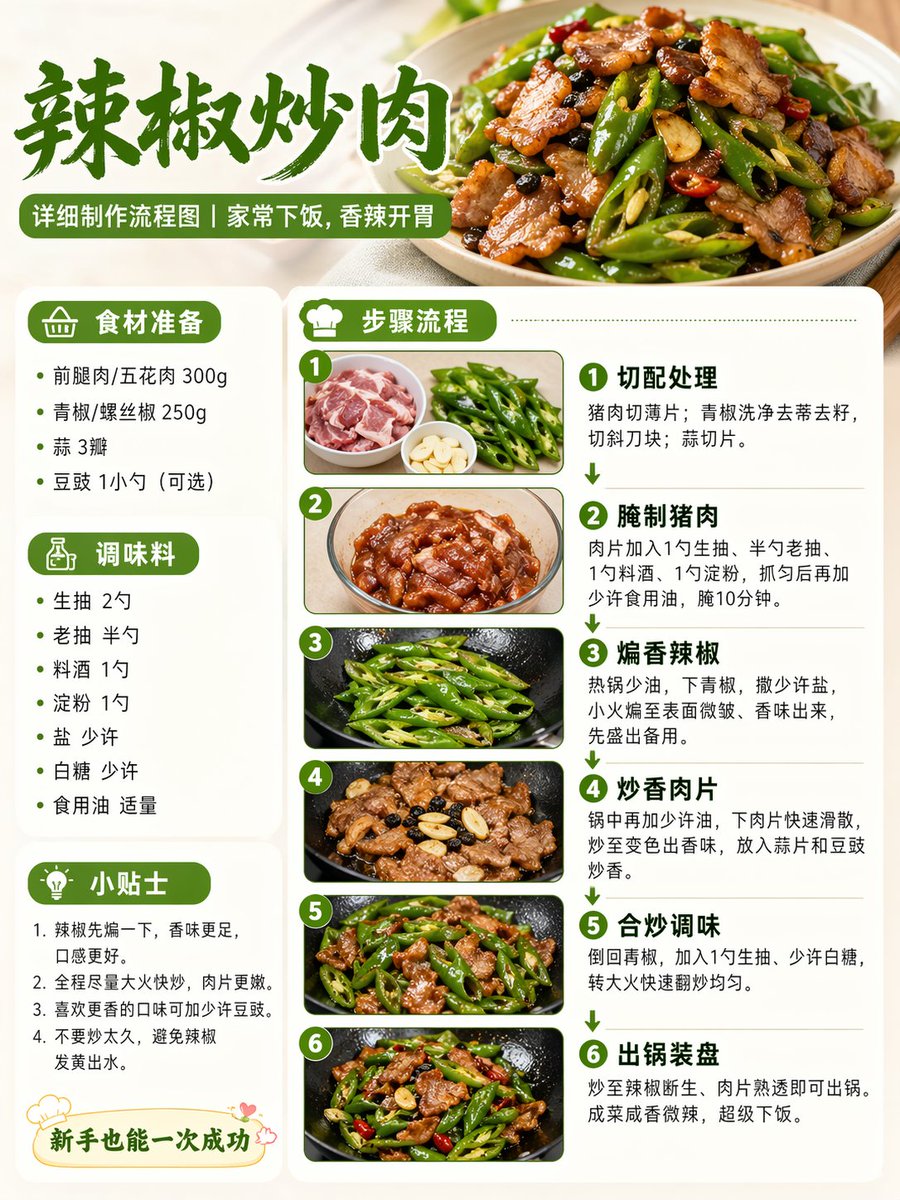
信息图可视化设计
Charts & Infographics
信息图可视化设计
Charts & Infographics
Help me create a detailed production flowchart for the dish {argument name="dish name" default="Fried Pork with Chili"}, in a realistic style, suitable for Xiaohongshu image-text proportions.
@Kurt_Rousey466
暂无图片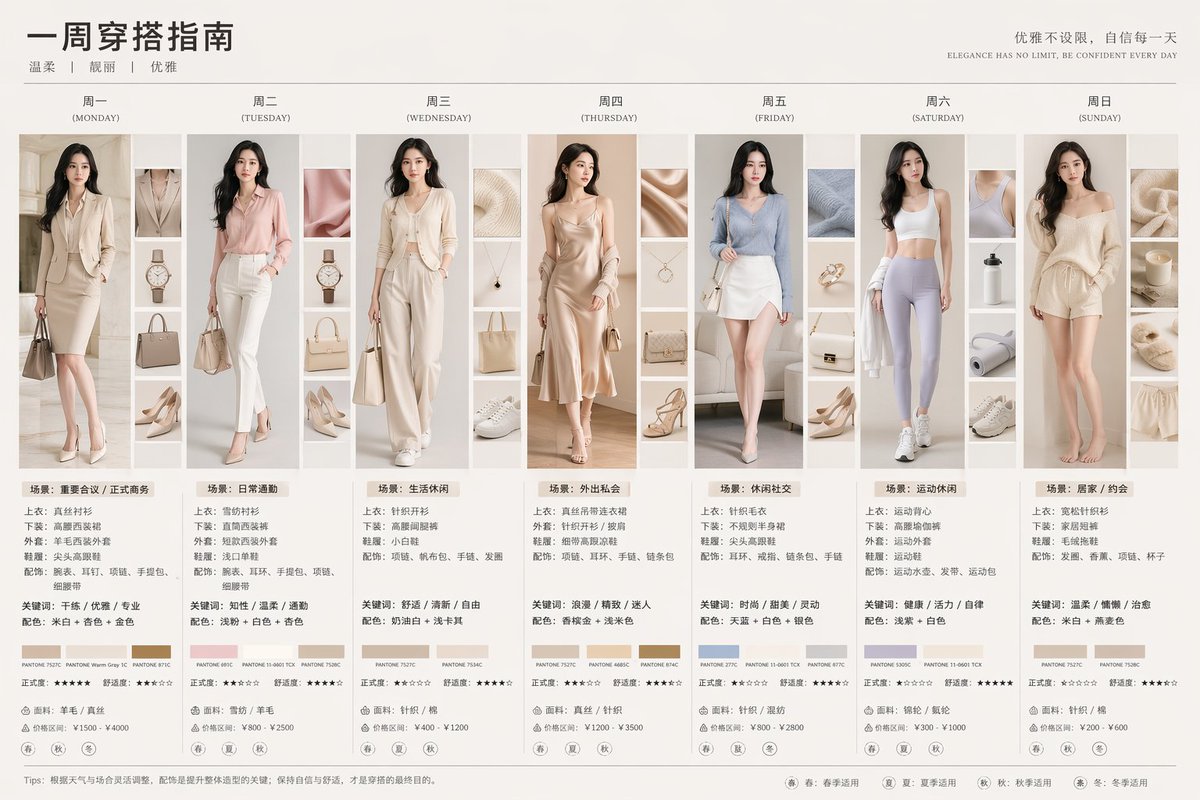
信息图可视化设计
Charts & Infographics
信息图可视化设计
Charts & Infographics
{ "type": "7-day fashion lookbook infographic", "header": { "title": "{argument name=\"main title\" default=\"一周穿搭指南\"}", "subtitle": "{argument name=\"style keywords\" default=\"温柔 | 靓丽 | 优雅\"}", "slogan_cn": "优雅不设限,自信每一天", "slogan_en": "{argument name=\"english slogan\" default=\"ELEGANCE HAS NO LIMIT, BE CONFIDENT EVERY DAY\"}" }, "subject": "{argument name=\"subject description\" default=\"young elegant Asian woman\"}", "layout": { "columns": 7, "column_elements": [ "day_header", "main_portrait", "4_detail_thumbnails", "outfit_specs", "keywords_colors", "3_color_swatches", "star_ratings", "fabric_price", "4_season_icons" ], "days": [ { "day": "周一 (MONDAY)", "outfit": "beige blazer suit", "scene": "场景:重要会议 / 正式商务" }, { "day": "周二 (TUESDAY)", "outfit": "pink blazer suit", "scene": "场景:日常通勤" }, { "day": "周三 (WEDNESDAY)", "outfit": "cream knit cardigan set", "scene": "场景:生活休闲" }, { "day": "周四 (THURSDAY)", "outfit": "champagne slip dress", "scene": "场景:外出私会" }, { "day": "周五 (FRIDAY)", "outfit": "blue knit top, white skirt", "scene": "场景:休闲社交" }, { "day": "周六 (SATURDAY)", "outfit": "white sports bra, purple leggings", "scene": "场景:运动休闲" }, { "day": "周日 (SUNDAY)", "outfit": "beige lounge knitwear", "scene": "场景:居家 / 约会" } ] }, "footer": { "tips": "{argument name=\"footer tips\" default=\"Tips: 根据天气与场合灵活调整,配饰是提升整体造型的关键;保持自信与舒适,才是穿搭的最终目的。\"}", "legend": [ "春: 春季适用", "夏: 夏季适用", "秋: 秋季适用", "冬: 冬季适用" ] } }
@yyyole
暂无图片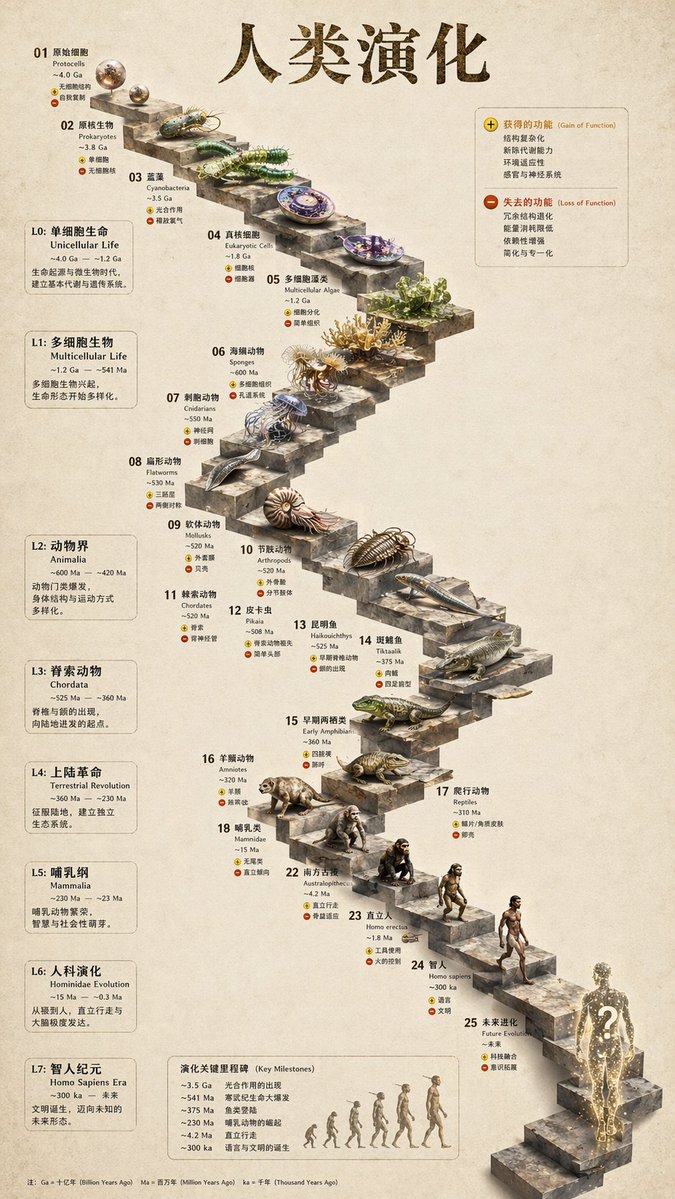
信息图可视化设计
Charts & Infographics
信息图可视化设计
Charts & Infographics
{ "type": "evolutionary timeline infographic", "instruction": "Using REFERENCE_0 as a structural base, transform the flat vector design into a highly realistic 3D infographic. Replace the smooth ramps with distinct stone steps and upgrade all organisms to photorealistic 3D models.", "style": { "background": "{argument name=\"background style\" default=\"vintage textured parchment paper\"}", "staircase": "{argument name=\"staircase material\" default=\"realistic textured stone blocks\"}", "subjects": "{argument name=\"organism style\" default=\"highly detailed photorealistic 3D renders\"}" }, "layout": { "main_title": "{argument name=\"main title\" default=\"人类演化\"}", "sections": [ { "position": "left sidebar", "count": 8, "labels": ["L0: 单细胞生命", "L1: 多细胞生物", "L2: 动物界", "L3: 脊索动物", "L4: 上陆革命", "L5: 哺乳纲", "L6: 人科演化", "L7: 智人纪元"] }, { "position": "top right", "title": "获得的功能 / 失去的功能", "description": "Legend with plus and minus icons" }, { "position": "bottom center", "title": "演化关键里程碑", "count": 6, "description": "Timeline with a silhouette graphic of 6 figures showing ape-to-human evolution" } ], "centerpiece": { "description": "Winding stone staircase with 25 numbered steps featuring specific organisms.", "count": 25, "notable_elements": [ "Step 07: Jellyfish", "Step 09: Ammonite", "Step 10: Trilobite", "Step 24: Walking human", "Step 25: {argument name=\"future evolution concept\" default=\"glowing cosmic silhouette with a question mark\"}" ] } } }
@GeekCatX